Core/Dash Diagnosis
CoreDash diagnosis extends your RUM data and provides real life solutions based on your CMS
Trusted by market leaders
CoreDash Diagnosis: The Root Cause Engine
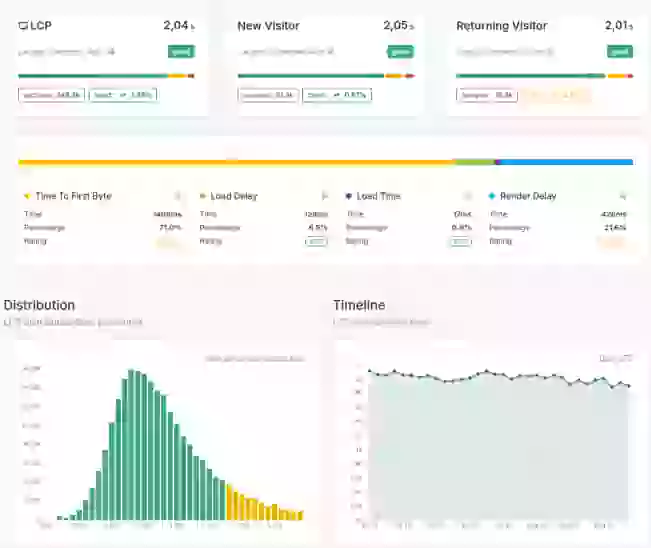
Real User Monitoring gives you the vital signs. Your LCP is 3.2 seconds. Your CLS is 0.25. Your INP is failing. This is exactly what RUM is designed to do. It shows the metrics that matter. It tells you that performance is degraded and where to focus. It's the first and essential step in fixing the Core Web Vitals.
But once you have the data, the real work begins. A failing LCP could be a slow server, an oversized image, a render-blocking script or all three. RUM shows you the symptom. The next logical step step is diagnosis.
CoreDash Diagnosis is the intelligence layer that turns metrics into fixes. It extends your RUM data with automated performance forensics, capturing detailed execution profiles from the browser to identify the exact bottleneck and generate the exact solution tailored to your CMS!.
From Measurement to Root Cause
You have the dashboard. LCP: 3.2s. You know where the problem is. Now you need to know why. Is it the hero image? The third-party scripts? The server response time? You could spend hours auditing the waterfall, profiling the main thread, and testing theories. Or you could let the diagnostic engine do it for you.
CoreDash Diagnosis takes the next logical step. It doesn't just measure performance. It reverse-engineers the failure.
LCP Diagnosis: Four Phases, One Answer
We decompose Largest Contentful Paint into its four constituent phases: TTFB, Load Delay, Load Duration, and Render Delay. When a phase fails, we don't just flag it. We explain it.
- Vendor Attribution: We don't report "high scripting time." We report that HubSpot's tracking script blocked the paint for 150ms or that Google Tag Manager delayed the render by 300ms. You see the vendor, the cost, and the impact.
- Anti-Pattern Detection: We scan for 14 specific architectural mistakes: lazy-loading the LCP image, hiding it in a CSS background, loading it from an unoptimized CDN. We catch the errors that audits miss.
- Code-Level Remediation: We generate the fix. If your LCP image has no priority hint, we write the
<link rel="preload">tag for you. If a script is blocking the render, we show you where to adddefer. The fix is copy-paste ready.
CLS Diagnosis: Catch the Ghost Bug
Layout shifts are the hardest bugs to reproduce. A font loads late on one connection. An ad renders slower on mobile. The shift happens once, and you never see it again.
CoreDash Diagnosis captures every frame. We record the shift, identify the element, and trace the root cause.
- The Element: We tell you exactly which DOM node moved. Not "somewhere in the header." The specific
<div>with the specific class. - The Trigger: We tell you why it moved. A web font swapped without a fallback declaration. A banner ad inserted itself without reserved space. An image loaded without dimensions.
- The Fix: We write the CSS. Add
aspect-ratio: 16/9to the image. Setfont-display: swapon the font face. Reservemin-height: 250pxfor the ad container. The shift never happens again.
INP Diagnosis: Find the Freeze
Interaction to Next Paint measures responsiveness. When it fails, the interface freezes. The user clicks a button, and nothing happens.
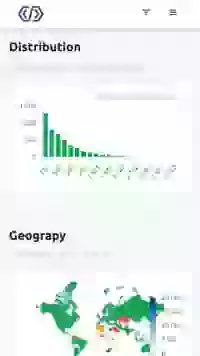
RUM data tells you "INP is poor." and where visitors have interacted with your page. We tell you which function is blocking the main thread and how ti fix it!
- Isolate the Interaction: We identify the exact input event: a button click, a form submission, a keypress. We know which interaction failed.
- Profile the Handler: We measure your event listener. We show you the execution time of your own code, down to the individual function. If your click handler runs a 200ms synchronous operation, we show you the 200ms.
- Detect Interference: Sometimes your code is fast. The browser is just busy. A third-party analytics library is processing data. A tracking pixel is firing a network request. We flag the background task that's stealing cycles from the user's interaction.
You stop optimizing blindly. You optimize the function that's actually causing the freeze.
Platform-Specific Solutions
Generic recommendations are useless.
"Serve images in next-gen formats" doesn't help a Shopify merchant who doesn't control the CDN. "Reduce JavaScript execution time" doesn't help a WordPress site owner who doesn't know which plugin is the problem.
CoreDash Diagnosis detects your stack and generates native code.
WordPress? We give you the PHP snippet or the specific plugin setting to change.
Next.js? We give you the next.config.js modification.
Shopify? We tell you which Liquid template to edit and show you the exact line to add.
We support Shopify, WordPress, WooCommerce, Magento, Drupal, Squarespace, Wix, Next.js, React, Vue.js, and Nuxt.js.
The recommendation isn't theoretical. It's executable.
The Difference Between Seeing and Solving
RUM tells you your site is slow.
CoreDash Diagnosis tells you that the Intercom chat widget is blocking the main thread for 200ms during the initial paint, and here's the script tag you need to modify to defer the load.
That's the difference between a metric and a solution.
CoreDash pricing
Starter
- 50K page-views / month
- 60 days data retention*
- track unlimited pages
- 1 domain
- CrUX tracking
Standard
- 150K page-views / month
- 365 days data retention*
- track unlimited pages
- 2 domains
- CrUX tracking
Enterprise
- 2M page-views / mo
- 365 days data retention*
- track unlimited pages
- 3 domains
- CrUX tracking
Sentinel
Agency: for agency packages and custom solutions read this

