Core Web Vitals Visualizer: Gratis Chrome-extensie voor het debuggen van CWV
Een gratis Chrome-extensie die een real-time overlay maakt van je Core Web Vitals, gebouwd voor developers die performance debuggen zonder DevTools te openen.

Een gratis Chrome-extensie voor het debuggen van Core Web Vitals
De Core Web Vitals Visualizer is een gratis Chrome-extensie die ik heb gebouwd om Core Web Vitals te debuggen zonder DevTools te openen. Het creëert een real-time overlay op elke pagina, waardoor je precies ziet welke elementen invloed hebben op je LCP, CLS, en INP. Meer dan 14.000 developers gebruiken het.
Laatst beoordeeld door Arjen Karel in maart 2026
Als Core Web Vitals specialist besteed ik veel tijd aan het controleren hoe een pagina reageert wanneer ik ermee interacteer. Wat doet dat met de Core Web Vitals en hoe veranderen de metrics wanneer ik overschakel naar mobiele emulatie of browser caching uitschakel?
Natuurlijk gebruik ik RUM tracking. Dat vertelt me op paginaniveau welke metrics slagen en falen. Maar waarom falen ze? Dat is iets wat je eigenlijk alleen kunt achterhalen wanneer je interacteert met de pagina.
Om mezelf veel tijd te besparen, besloot ik een klein deel van een langdurig proces te automatiseren en een Chrome-extensie te maken die een deel van het vervelende werk voor me doet. Het resultaat is de Core Web Vitals Visualizer. Ik heb besloten om het voor iedereen beschikbaar te maken, dus ga je gang en bekijk het in de Chrome Web Store.
Wat doet de Core Web Vitals Visualizer?
Allereerst registreert het de Core Web Vitals op basis van je interactie met de pagina. Het volgt de Largest Contentful Paint, de Interaction to Next Paint, de Cumulative Layout Shift, de First Contentful Paint, en de Time to First Byte.
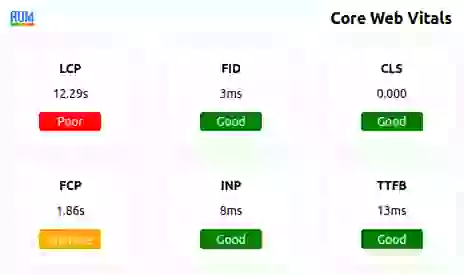
Vervolgens creëert het een overlay die al deze metrics visualiseert. Dit vertelt je welk element de Largest Contentful Paint is, welke elementen visuele instabiliteit veroorzaken, en als je met de pagina hebt geïnteracteerd, welk event de ergste input delay veroorzaakte.

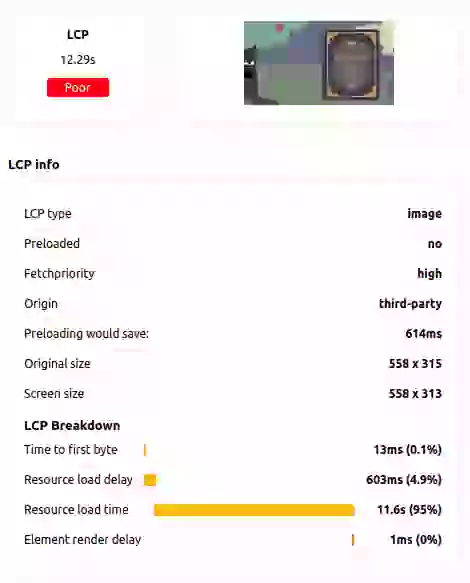
Wanneer je op een van de metrics klikt, breekt de Core Web Vitals Visualizer ze op in hun meest basale componenten. Voor LCP betekent dat dat je de resource load delay, load duration, en element render delay ziet. Voor INP krijg je de input delay, processing time, en presentation delay.
Waarom geen Lighthouse gebruiken?
Ik krijg deze vraag vaak. Mijn antwoord is altijd: "Ik heb nooit gezegd dat ik Lighthouse niet gebruik" (hoewel ik Lighthouse niet zo vaak gebruik). Lighthouse is een geweldige tool en je zou er vertrouwd mee moeten raken.
Maar er zijn belangrijke verschillen. Lighthouse is een lab test en de data is mogelijk niet representatief voor de praktijk. Daarom gebruikt mijn extensie de echte data van je browser. Lighthouse geeft je ook geen echte interactieresultaten. Het kan geen INP meten omdat er geen echte gebruiker met de pagina interacteert. In plaats daarvan gebruikt het Total Blocking Time als een proxy. Mijn extensie visualiseert de daadwerkelijke CLS terwijl deze plaatsvindt, en breekt de LCP en INP op in hun sub-onderdelen, zodat je precies kunt zien waar de tijd naartoe gaat.
Hoe zit het met de Web Vitals-extensie van Google?
Google heeft hun Web Vitals Chrome-extensie afgeschaft in januari 2025. Ze raden nu aan om in plaats daarvan het DevTools Performance paneel te gebruiken. DevTools is krachtig, maar soms wil je gewoon een snelle overlay zonder een volledige profiling sessie te openen. Dat is precies wat de Core Web Vitals Visualizer doet. Het biedt ook de breakdowns van metric sub-onderdelen die DevTools niet in één overzicht laat zien.
Installeer de Core Web Vitals Visualizer
Ga naar de Chrome Web Store en installeer de Core Web Vitals Visualizer. En misschien, als je het leuk vindt, laat dan een review achter. Dat zou ik waarderen.
Zoek uit wat echt traag is.
Ik leg je critical rendering path bloot met echte data. Je krijgt een fix-lijst op prioriteit, geen Lighthouse-rapport.
Boek een audit
