How to Pass Core Web Vitals: Step by Step (2026)
A systematic workflow for passing all three Core Web Vitals: assess, prioritize, fix TTFB, LCP, INP, CLS, verify with field data, and monitor.

To pass the Core Web Vitals you need all three metrics rated "good" at the 75th percentile in Google's CrUX field data: LCP under 2.5 seconds, INP under 200 milliseconds, and CLS under 0.1. Start by checking Google Search Console to identify which metric is failing and on which pages. Then work in priority order: fix TTFB first (hosting, caching, CDN), then LCP (images, preloading), then INP (JavaScript), then CLS (dimensions, fonts).
Last reviewed by Arjen Karel on February 2026

The Fastest Path to Passing Core Web Vitals
You know your Core Web Vitals need work. Google Search Console is showing red or orange, a client is asking questions, or PageSpeed Insights just delivered bad news. This page is the workflow I use to get sites from failing to passing as fast as possible.
Table of Contents!
- The Fastest Path to Passing Core Web Vitals
- Step 1: Assess Where You Stand
- Step 2: Identify Which Metric to Fix First
- Step 3: Fix the Foundation (TTFB)
- Step 4: Fix LCP
- Step 5: Fix INP
- Step 6: Fix CLS
- Step 7: Verify with Field Data
- Step 8: Monitor and Maintain
- Quick Wins: The Fixes with the Biggest Impact
- Passing Core Web Vitals FAQ
I have used this workflow to help sites pass Core Web Vitals on hundreds of thousands of pages. It works on WordPress, Shopify, custom builds, and every platform in between. The order in which you fix things matters. Fix the foundation first, then work outward. Otherwise you waste time optimizing things that a deeper problem will override.
Where the Web Stands Right Now
According to the 2025 Web Almanac (based on CrUX data from July 2025), 48% of mobile websites and 56% of desktop websites pass all three Core Web Vitals. That is an improvement from 44% mobile in 2024, but it still means more than half the mobile web is failing.
Breaking it down by metric (percentage of origins rated "good" on mobile):
| Metric | Mobile "Good" Rate | Threshold | Difficulty |
|---|---|---|---|
| CLS | 81% | ≤ 0.1 | Easiest to pass |
| INP | 77% | ≤ 200ms | Most sites pass (but hard to fix when failing) |
| LCP | 62% | ≤ 2.5s | Hardest. Main reason sites fail overall CWV. |
Source: 2025 Web Almanac (HTTP Archive, July 2025 CrUX data). CoreDash RUM data across monitored sites shows similar distributions.
LCP is the bottleneck. 77% pass INP and 81% pass CLS, but only 62% pass LCP. That is what drags the overall pass rate down to 48%. This is why the workflow below prioritizes TTFB and LCP first.
CoreDash aggregate data tells the same story. Across sites that implemented this exact workflow (TTFB → LCP → INP → CLS in order), the average time from "failing" to "passing all three metrics" in CrUX was 4 to 6 weeks: 1 to 2 weeks for implementation, plus 2 to 4 weeks for the 28 day CrUX rolling window to reflect the improvements. Sites that skipped straight to JavaScript optimization without fixing TTFB first took 2 to 3 times longer to reach passing because the foundation was unstable.
Step 1: Assess Where You Stand
Before changing anything, figure out exactly which metrics are failing and on which pages. If you skip this and guess, you will waste time fixing the wrong things.
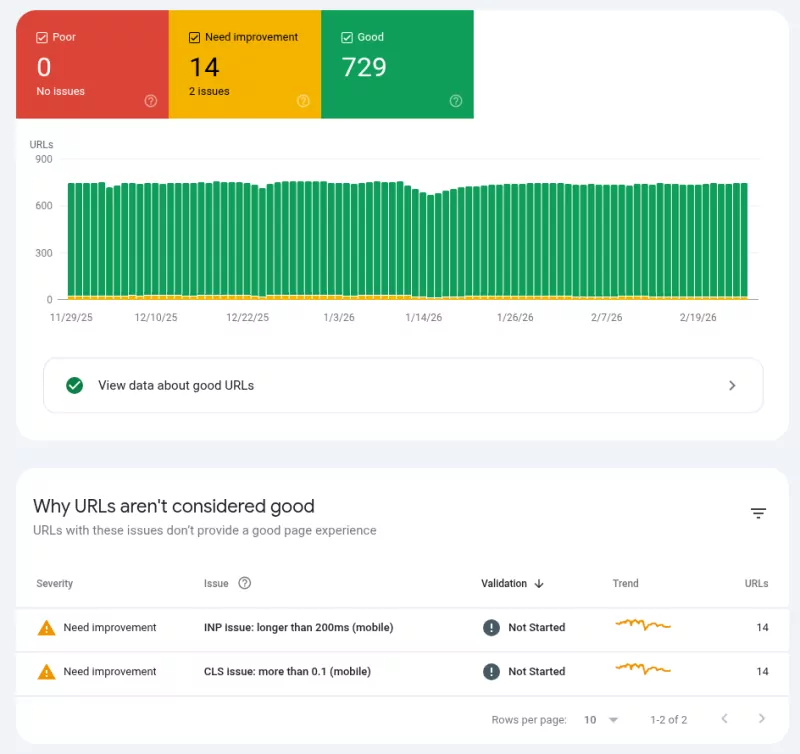
Check Google Search Console
Go to your Search Console property and open the Core Web Vitals report under "Experience." This shows you:
- How many URLs are rated Good, Needs Improvement, or Poor
- Which specific metric is failing (LCP, INP, or CLS)
- URL groups that share the same issue (e.g., all product pages failing on INP)
Search Console uses real field data from Chrome users over a 28 day rolling window. This is the data Google uses for ranking. If Search Console shows you are passing, you are passing, regardless of what Lighthouse says.
Run PageSpeed Insights on Key Pages
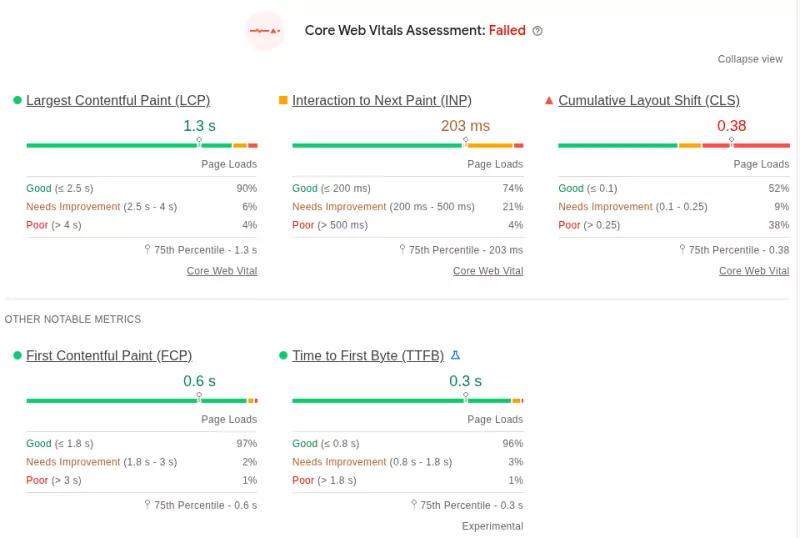
Test at least one URL of each page type: your homepage, a blog post, a product page, a category/collection page. PageSpeed Insights gives you both field data (if available) and lab data with specific diagnostics.
Look at the field data section first (labeled "Discover what your real users are experiencing"). If it shows green for all three metrics, that page passes. If field data is unavailable, the page does not have enough traffic for CrUX data. Google may use origin level or URL group data instead.
Set Up Real User Monitoring
Search Console and CrUX have a 28 day rolling window, which means improvements take weeks to show up. To see the immediate impact of your changes, set up a Real User Monitoring (RUM) solution like CoreDash. RUM gives you real time field data for every page, every device, and every country, so you can verify each fix works before moving to the next one.
Step 2: Identify Which Metric to Fix First
If multiple metrics are failing, fix them in this order:
| Priority | Metric | Why This Order |
|---|---|---|
| 1 | TTFB (diagnostic) | Slow server response delays everything else. Fix this before touching frontend. |
| 2 | LCP | Hardest metric to pass (only 62% of mobile origins rated "good" in CrUX). Highest impact on user perception. |
| 3 | INP | 77% of mobile origins pass. JavaScript optimization often overlaps with LCP fixes. Address after images and loading are sorted. |
| 4 | CLS | 81% of mobile origins pass. Often fixable with dimension attributes and font loading changes alone. |
TTFB is not a Core Web Vital itself, but every millisecond of TTFB is a millisecond added directly to your LCP and FCP. A page with 800ms TTFB has already used a third of the 2.5 second LCP budget before the browser even starts rendering. The CrUX "good" threshold for TTFB is 800ms, but faster is always better because any TTFB improvement transfers directly to your paint metrics. Learn more in our Time to First Byte guide.
Step 3: Fix the Foundation (TTFB)
If your Time to First Byte is above 400ms consistently, start here. The usual problems:
- Slow hosting: upgrade to quality hosting with server level caching. Managed hosts for WordPress (Kinsta, SiteGround, Cloudways) or Shopify's built in infrastructure handle this.
- No page caching: ensure your CMS caches the fully rendered HTML so the server does not regenerate it on every request.
- No CDN: set up a CDN (Cloudflare is free) to serve pages from edge locations close to visitors. See Cloudflare configuration guide.
- Redirects: every redirect adds a full round trip. Eliminate unnecessary redirect chains.
- Slow backend: unoptimized database queries, excessive WordPress plugins, or heavy server side processing. Use query monitoring tools to identify bottlenecks.
Target: get TTFB below 200ms for most visitors. At minimum, below 400ms.
Step 4: Fix LCP
Once TTFB is solid, fix Largest Contentful Paint. The process:
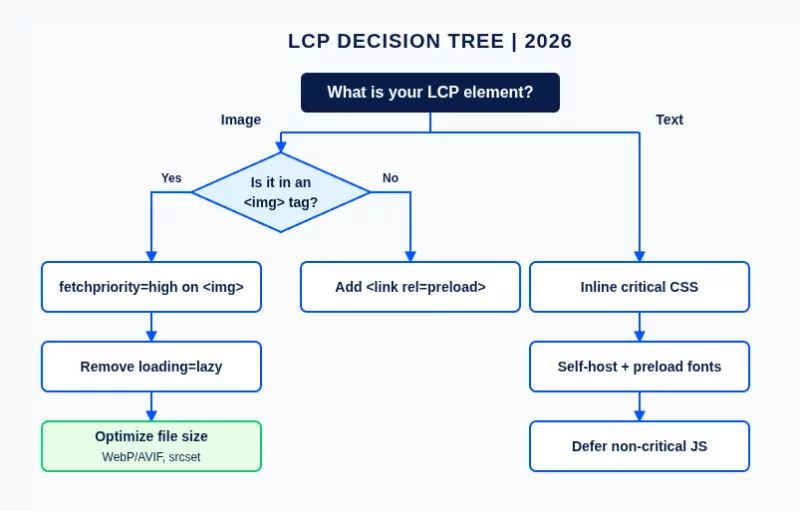
Identify Your LCP Element
Run your failing page in PageSpeed Insights and find the "Largest Contentful Paint element" in the Diagnostics section. It is usually a hero image, featured image, or large text block.
If LCP Is an Image
- Make sure the browser can find it in the HTML. The image URL must be in a regular
<img src="">tag, not hidden behind adata-srcattribute or loaded by JavaScript. If the browser's HTML parser cannot see the image URL, it cannot start loading it early. According to the 2025 Web Almanac, 7% of websites still hide their LCP image this way. - Add
fetchpriority="high"to the<img>tag. This tells the browser to prioritize this image over other resources competing for bandwidth. Without it, the browser may download stylesheets, scripts, and other images first. In a Google test on Google Flights, this single change improved LCP from 2.6s to 1.9s. - Remove
loading="lazy". Lazy loading delays the request until the image is near the viewport. On an LCP image, that delay goes straight into your LCP score. - Optimize the file size. Convert to WebP or AVIF. Serve the correct dimensions for the viewport using
srcsetandsizes. - If the image is not in the HTML (CSS background image, loaded via JavaScript, or on a page where you cannot change the
<img>tag): add a preload. Use<link rel="preload" as="image" href="..." fetchpriority="high">in the<head>. Preload forces the browser to discover the image early even when it is not visible in the HTML source. For images that are already in a normal<img>tag, preload is usually unnecessary because the parser already finds them.
If LCP Is Text
- Eliminate render blocking CSS. Generate and inline critical CSS so the browser can render text without waiting for external stylesheets.
- Optimize font loading. Self host your fonts and preload the primary font file to reduce the time before text renders.
- Minimize render blocking JavaScript. Defer non critical JavaScript so it does not block the HTML parser.
Step 5: Fix INP
Once LCP is passing, address Interaction to Next Paint. INP fails when JavaScript blocks the main thread during user interactions.
Find the Bottleneck
Open Chrome DevTools, go to the Performance panel, and record yourself interacting with the page. Look for long tasks (tasks over 50ms, shown as red bars). These are what block the browser from responding to your clicks.
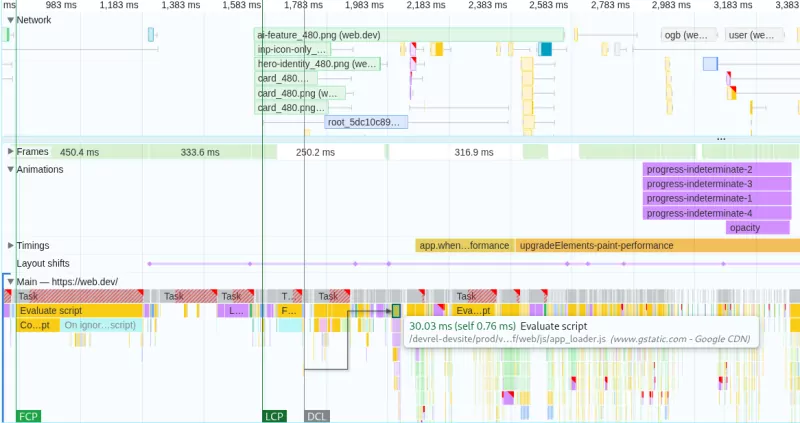
What usually blocks the main thread:
- Third party scripts (analytics, ads, chat widgets, marketing tags) competing for main thread time
- Large JavaScript bundles from frameworks, page builders, or plugins executing during page load
- Unoptimized event handlers that do too much work in response to a click or keypress
The Fix Priority
- Delay third party scripts. Chat, analytics, social, and marketing scripts should load after the first user interaction, not during page load.
- Defer non critical first party JavaScript. Use
deferorasyncon scripts that do not need to execute before the page is interactive. - Break up long tasks. If your own code has functions that take over 50ms, yield to the main thread to allow the browser to process user input between chunks of work. The modern way is
scheduler.yield()(supported in Chrome 129+ and Edge). For broader browser support, fall back to wrapping work insetTimeout(resolve, 0)inside a Promise:async function yieldToMain() { if ('scheduler' in window && 'yield' in scheduler) { return scheduler.yield(); } return new Promise(resolve => setTimeout(resolve, 0)); } - Remove unused JavaScript. Use Chrome DevTools Coverage tab to identify JavaScript that loads but never executes. Remove it or load it conditionally.
For the complete INP optimization strategy, see our INP optimization guide.
Step 6: Fix CLS
CLS is usually the easiest metric to fix. The most common causes and solutions:
Images Without Dimensions
Every <img> tag needs explicit width and height attributes. Without them, the browser does not know how much space to reserve and content shifts when the image loads. This is the #1 cause of CLS globally. See our CLS guide.
Web Font Swapping
When a web font loads and replaces the fallback, text can reflow and shift surrounding elements. Fix: self host fonts, use font-display: optional or use the CSS size-adjust property to match the fallback font metrics to the web font.
Dynamically Injected Content
Cookie banners, notification bars, ad slots, and popups that push content down after load. Fix: reserve space for these elements with CSS min-height or load them in a way that does not affect surrounding layout (e.g., overlays instead of inline injection).
Step 7: Verify with Field Data
After implementing your fixes, you need to verify they work in the real world, not just in Lighthouse.
- Immediate verification: use CoreDash or another RUM tool to see real time field data. Changes should be visible within hours.
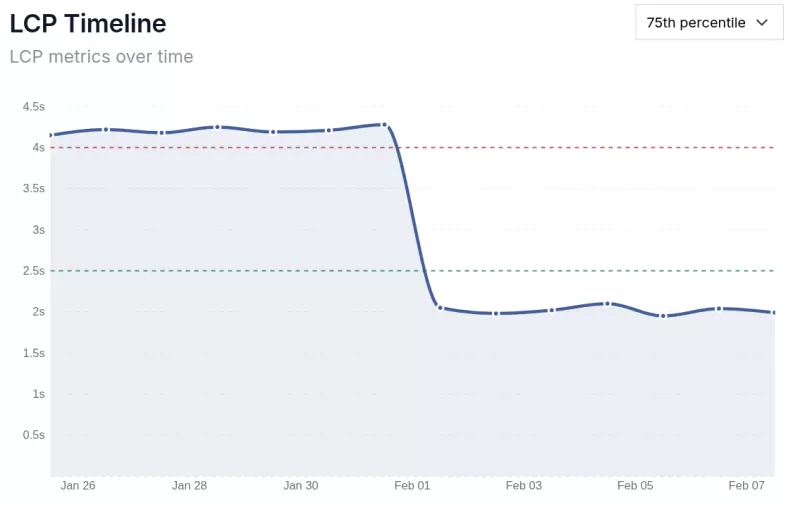
- CrUX verification: the Chrome User Experience Report uses a 28 day rolling window. Expect 2 to 4 weeks before improvements fully reflect in CrUX data.
- Search Console verification: the Core Web Vitals report in Search Console updates based on CrUX. Once CrUX shows improvement, Search Console will follow.
This lag is why RUM is essential. Without it, you have no visibility into whether your changes actually worked until weeks later.
Step 8: Monitor and Maintain
Performance regresses. Every new plugin, theme update, or third party script can undo your work. Set up ongoing monitoring:
- Check Search Console Core Web Vitals report weekly
- Use CoreDash for continuous real time monitoring with alerts
- Re test in PageSpeed Insights after every significant change (new plugin, theme update, new third party script)
- Audit third party scripts quarterly. Remove any that are no longer needed.
For a complete reference of everything you should be checking, use our Ultimate Core Web Vitals Checklist.
Quick Wins: The Fixes with the Biggest Impact
If you only have time for five things, these are the highest impact fixes across all platforms:
| Fix | Metric Improved | Typical Impact |
|---|---|---|
| Preload the LCP image with fetchpriority="high" | LCP | 500ms to 1500ms improvement |
| Enable page caching + CDN | LCP (via TTFB) | 200ms to 800ms improvement |
| Delay third party scripts until interaction | INP | 50ms to 300ms improvement |
| Add width/height to all images | CLS | 0.05 to 0.3 reduction |
| Self host fonts + font-display: optional | CLS + LCP | Eliminates font related CLS, improves LCP 100ms to 300ms |
These impact ranges come from CoreDash real user monitoring data across optimization projects. Your actual improvement depends on your starting point, your hosting, and your traffic profile. Sites starting from very poor scores (LCP above 5 seconds) often see even larger improvements. Sites already close to the threshold may see smaller absolute gains but the difference between failing and passing.
The 2025 Web Almanac data supports these priorities. Home pages pass Core Web Vitals at 45% on mobile, while secondary pages pass at 56%. The gap is because home pages tend to have more dynamic content, larger hero images, and more third party scripts. If your homepage is failing but internal pages are passing, focus your LCP and INP optimization effort on the homepage template specifically.
CoreDash has MCP built in.
Connect it to Claude or any AI agent. Ask it why your INP spiked last Tuesday.
See how it worksPassing Core Web Vitals FAQ
How long does it take to pass Core Web Vitals after making improvements?
The CrUX dataset (which Google uses for ranking) has a 28 day rolling window. After implementing fixes, expect 2 to 4 weeks before improvements fully reflect in CrUX data and Google Search Console. The change is gradual: as new "good" visits accumulate and old "poor" visits age out of the window, your scores improve incrementally. To see immediate results, use a Real User Monitoring tool like CoreDash which shows real time field data.
My Lighthouse score is good but Search Console shows failing Core Web Vitals. Why?
Lighthouse runs a single simulated visit under controlled conditions. Search Console uses field data from real Chrome users on real devices and networks. A visitor on a low end Android phone on 3G will have a completely different experience than Lighthouse's simulation. Field data is what Google uses for ranking, so that is what you should optimize for. The gap between Lighthouse and field data usually comes from: real users on slower mobile devices, geographic distance from your server, and third party scripts that fire during real interactions but not during a Lighthouse test.
Do I need to pass Core Web Vitals on every page?
Google evaluates Core Web Vitals at the URL level, then falls back to URL group level and origin level data. Ideally, every page should pass. In practice, focus first on your highest traffic pages and your most important page templates (homepage, product pages, landing pages, key blog posts). A page that gets 10 visits a month has less impact on your overall site assessment than a page that gets 10,000. Google Search Console groups URLs by issue type, so fixing a problem on one page template often fixes it for all pages using that template.
What is the most common reason sites fail Core Web Vitals?
LCP is the most commonly failed metric. According to the 2025 Web Almanac, only 62% of mobile origins achieve a good LCP score. The most common causes are: unoptimized or lazy loaded hero images, slow server response times (high TTFB), render blocking CSS and JavaScript, and images loaded via JavaScript instead of being discoverable in the HTML source. Fixing LCP typically has the biggest overall impact on your Core Web Vitals pass rate.
Will passing Core Web Vitals dramatically improve my search rankings?
Core Web Vitals are a confirmed Google ranking factor, but content relevance and authority are far more important. Google has described page experience as a tiebreaker: when two pages are roughly equal in content quality, the one with better Core Web Vitals will rank higher. Passing Core Web Vitals will not compensate for thin content or weak backlinks. However, in competitive niches where many sites have similar content quality, Core Web Vitals can provide a measurable ranking advantage. The bigger benefit is often indirect: faster, more responsive sites have lower bounce rates, higher engagement, and better conversion rates.

