Core Web Vitals halen: stap voor stap (2026)
Een systematische workflow om alle drie de Core Web Vitals te halen: beoordeel, prioriteer, fix TTFB, LCP, INP, CLS, verifieer met velddata en monitor.

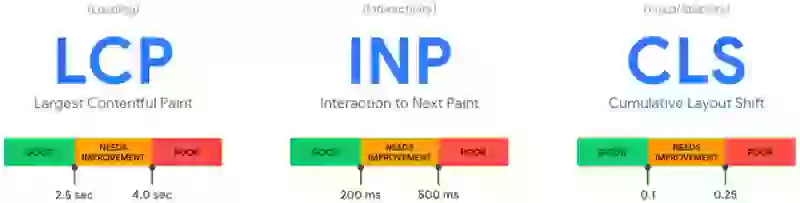
Om de Core Web Vitals te halen moeten alle drie de metrieken als "goed" worden beoordeeld op het 75e percentiel in Google's CrUX-velddata: LCP onder 2,5 seconden, INP onder 200 milliseconden en CLS onder 0,1. Begin met het controleren van Google Search Console om te identificeren welke metriek faalt en op welke pagina's. Werk vervolgens in prioriteitsvolgorde: fix TTFB eerst (hosting, caching, CDN), dan LCP (afbeeldingen, preloading), dan INP (JavaScript), dan CLS (dimensies, lettertypen).
Laatst beoordeeld door Arjen Karel in februari 2026
Het snelste pad naar het halen van Core Web Vitals
Je weet dat je Core Web Vitals werk nodig hebben. Google Search Console toont rood of oranje, een klant stelt vragen, of PageSpeed Insights heeft net slecht nieuws gebracht. Deze pagina is de workflow die ik gebruik om sites zo snel mogelijk van falend naar geslaagd te krijgen.
Table of Contents!
- Het snelste pad naar het halen van Core Web Vitals
- Stap 1: Beoordeel waar je staat
- Stap 2: Identificeer welke metriek je eerst moet fixen
- Stap 3: Fix de basis (TTFB)
- Stap 4: Fix LCP
- Stap 5: Fix INP
- Stap 6: Fix CLS
- Stap 7: Verifieer met velddata
- Stap 8: Monitor en onderhoud
- Snelle winsten: de fixes met de grootste impact
- Veelgestelde vragen over het halen van Core Web Vitals
Ik heb deze workflow gebruikt om sites te helpen Core Web Vitals te halen op honderdduizenden pagina's. Het werkt op WordPress, Shopify, custom builds en elk platform daartussenin. De volgorde waarin je dingen fixt is belangrijk. Fix eerst de basis, werk dan naar buiten. Anders verspil je tijd aan het optimaliseren van dingen die een dieper probleem tenietdoet.
Waar het web nu staat
Volgens de 2025 Web Almanac (gebaseerd op CrUX-data van juli 2025) haalt 48% van de mobiele websites en 56% van de desktopwebsites alle drie de Core Web Vitals. Dat is een verbetering ten opzichte van 44% mobiel in 2024, maar het betekent nog steeds dat meer dan de helft van het mobiele web faalt.
Uitgesplitst per metriek (percentage origins beoordeeld als "goed" op mobiel):
| Metriek | Mobiel "Goed" percentage | Drempelwaarde | Moeilijkheid |
|---|---|---|---|
| CLS | 81% | ≤ 0.1 | Makkelijkst om te halen |
| INP | 77% | ≤ 200ms | De meeste sites halen het (maar moeilijk te fixen als het faalt) |
| LCP | 62% | ≤ 2.5s | Moeilijkst. Voornaamste reden dat sites falen op totale CWV. |
Bron: 2025 Web Almanac (HTTP Archive, juli 2025 CrUX-data). CoreDash RUM-data van gemonitorde sites toont vergelijkbare verdelingen.
LCP is het knelpunt. 77% haalt INP en 81% haalt CLS, maar slechts 62% haalt LCP. Dat is wat het totale slagingspercentage naar 48% trekt. Daarom geeft de onderstaande workflow prioriteit aan TTFB en LCP.
CoreDash geaggregeerde data vertelt hetzelfde verhaal. Op sites die precies deze workflow implementeerden (TTFB → LCP → INP → CLS in volgorde), was de gemiddelde tijd van "falend" naar "alle drie metrieken halen" in CrUX 4 tot 6 weken: 1 tot 2 weken voor implementatie, plus 2 tot 4 weken voor het 28-daagse CrUX rolling window om de verbeteringen weer te geven. Sites die direct naar JavaScript-optimalisatie sprongen zonder eerst TTFB te fixen deden er 2 tot 3 keer langer over om te slagen omdat de basis instabiel was.
Stap 1: Beoordeel waar je staat
Voordat je iets verandert, zoek precies uit welke metrieken falen en op welke pagina's. Als je dit overslaat en gokt, verspil je tijd aan het fixen van de verkeerde dingen.
Controleer Google Search Console
Ga naar je Search Console-eigenschap en open het Core Web Vitals-rapport onder "Ervaring." Dit toont je:
- Hoeveel URL's zijn beoordeeld als Goed, Verbetering nodig, of Slecht
- Welke specifieke metriek faalt (LCP, INP of CLS)
- URL-groepen die hetzelfde probleem delen (bijv. alle productpagina's die falen op INP)
Search Console gebruikt echte velddata van Chrome-gebruikers over een rollend venster van 28 dagen. Dit zijn de data die Google gebruikt voor ranking. Als Search Console toont dat je slaagt, dan slaag je, ongeacht wat Lighthouse zegt.

Voer PageSpeed Insights uit op belangrijke pagina's
Test ten minste één URL van elk paginatype: je homepage, een blogpost, een productpagina, een categorie-/collectiepagina. PageSpeed Insights geeft je zowel velddata (indien beschikbaar) als labdata met specifieke diagnostiek.
Kijk eerst naar de velddatasectie (gelabeld "Ontdek wat je echte gebruikers ervaren"). Als het groen toont voor alle drie de metrieken, haalt die pagina het. Als velddata niet beschikbaar is, heeft de pagina niet genoeg verkeer voor CrUX-data. Google kan in plaats daarvan origin-niveau of URL-groepdata gebruiken.

Stel Real User Monitoring in
Search Console en CrUX hebben een rollend venster van 28 dagen, wat betekent dat verbeteringen weken nodig hebben om zichtbaar te worden. Om de directe impact van je wijzigingen te zien, stel een Real User Monitoring (RUM)-oplossing in zoals CoreDash. RUM geeft je realtime velddata voor elke pagina, elk apparaat en elk land, zodat je kunt verifiëren dat elke fix werkt voordat je doorgaat naar de volgende.
Stap 2: Identificeer welke metriek je eerst moet fixen
Als meerdere metrieken falen, fix ze in deze volgorde:
| Prioriteit | Metriek | Waarom deze volgorde |
|---|---|---|
| 1 | TTFB (diagnostisch) | Trage serverrespons vertraagt al het andere. Fix dit voordat je aan de frontend begint. |
| 2 | LCP | Moeilijkste metriek om te halen (slechts 62% van mobiele origins beoordeeld als "goed" in CrUX). Grootste impact op gebruikerservaring. |
| 3 | INP | 77% van mobiele origins haalt het. JavaScript-optimalisatie overlapt vaak met LCP-fixes. Pak dit aan nadat afbeeldingen en laden zijn opgelost. |
| 4 | CLS | 81% van mobiele origins haalt het. Vaak op te lossen met alleen dimensieattributen en wijzigingen in het laden van lettertypen. |
TTFB is zelf geen Core Web Vital, maar elke milliseconde TTFB is een milliseconde die direct wordt toegevoegd aan je LCP en FCP. Een pagina met 800ms TTFB heeft al een derde van het 2,5 seconden LCP-budget verbruikt voordat de browser zelfs maar begint met renderen. De CrUX "goed"-drempel voor TTFB is 800ms, maar sneller is altijd beter omdat elke TTFB-verbetering direct doorwerkt in je paint-metrieken. Lees meer in onze Time to First Byte-gids.
Stap 3: Fix de basis (TTFB)
Als je Time to First Byte consistent boven de 400ms is, begin hier. De gebruikelijke problemen:
- Trage hosting: upgrade naar kwaliteitshosting met caching op serverniveau. Managed hosts voor WordPress (Kinsta, SiteGround, Cloudways) of de ingebouwde infrastructuur van Shopify regelen dit.
- Geen paginacaching: zorg ervoor dat je CMS de volledig gerenderde HTML cachet zodat de server deze niet bij elk verzoek opnieuw hoeft te genereren.
- Geen CDN: stel een CDN in (Cloudflare is gratis) om pagina's te serveren vanaf edge-locaties dicht bij bezoekers. Zie de Cloudflare-configuratiegids.
- Redirects: elke redirect voegt een volledige round trip toe. Elimineer onnodige redirect-ketens.
- Trage backend: niet-geoptimaliseerde databasequeries, te veel WordPress-plugins of zware server-side verwerking. Gebruik query-monitoringtools om knelpunten te identificeren.
Doel: krijg TTFB onder 200ms voor de meeste bezoekers. Op zijn minst onder 400ms.
Stap 4: Fix LCP
Zodra TTFB solide is, fix Largest Contentful Paint. Het proces:
Identificeer je LCP-element
Voer je falende pagina uit in PageSpeed Insights en zoek het "Largest Contentful Paint element" in de Diagnostiek-sectie. Het is meestal een hero-afbeelding, uitgelichte afbeelding of groot tekstblok.
Als LCP een afbeelding is
- Zorg ervoor dat de browser het kan vinden in de HTML. De afbeeldings-URL moet in een gewone
<img src="">-tag staan, niet verborgen achter eendata-src-attribuut of geladen door JavaScript. Als de HTML-parser van de browser de afbeeldings-URL niet kan zien, kan hij niet vroeg beginnen met laden. Volgens de 2025 Web Almanac verbergt 7% van de websites hun LCP-afbeelding nog steeds op deze manier. - Voeg
fetchpriority="high"toe aan de<img>-tag. Dit vertelt de browser om deze afbeelding te prioriteren boven andere resources die strijden om bandbreedte. Zonder dit kan de browser eerst stylesheets, scripts en andere afbeeldingen downloaden. In een Google-test op Google Flights verbeterde deze ene wijziging de LCP van 2,6s naar 1,9s. - Verwijder
loading="lazy". Lazy loading vertraagt het verzoek totdat de afbeelding bij de viewport is. Bij een LCP-afbeelding gaat die vertraging recht in je LCP-score. - Optimaliseer de bestandsgrootte. Converteer naar WebP of AVIF. Serveer de juiste dimensies voor de viewport met behulp van
srcsetensizes. - Als de afbeelding niet in de HTML staat (CSS-achtergrondafbeelding, geladen via JavaScript, of op een pagina waar je de
<img>-tag niet kunt wijzigen): voeg een preload toe. Gebruik<link rel="preload" as="image" href="..." fetchpriority="high">in de<head>. Preload dwingt de browser om de afbeelding vroeg te ontdekken, zelfs wanneer deze niet zichtbaar is in de HTML-broncode. Voor afbeeldingen die al in een normale<img>-tag staan, is preload meestal onnodig omdat de parser ze al vindt.
Als LCP tekst is
- Elimineer renderblokkerende CSS. Genereer en inline critical CSS zodat de browser tekst kan renderen zonder te wachten op externe stylesheets.
- Optimaliseer het laden van lettertypen. Host je lettertypen zelf en preload het primaire lettertypebestand om de tijd te verkorten voordat tekst wordt gerenderd.
- Minimaliseer renderblokkerende JavaScript. Stel niet-kritieke JavaScript uit zodat het de HTML-parser niet blokkeert.

Stap 5: Fix INP
Zodra LCP slaagt, pak Interaction to Next Paint aan. INP faalt wanneer JavaScript de main thread blokkeert tijdens gebruikersinteracties.
Vind het knelpunt
Open Chrome DevTools, ga naar het Performance-paneel en neem op terwijl je met de pagina interacteert. Zoek naar long tasks (taken langer dan 50ms, getoond als rode balken). Dit zijn de taken die de browser blokkeren om te reageren op je klikken.

Wat meestal de main thread blokkeert:
- Scripts van derden (analytics, advertenties, chatwidgets, marketingtags) die concurreren om main thread-tijd
- Grote JavaScript-bundels van frameworks, paginabouwers of plugins die uitvoeren tijdens het laden van de pagina
- Niet-geoptimaliseerde event handlers die te veel werk doen als reactie op een klik of toetsaanslag
De fixprioriteit
- Stel scripts van derden uit. Chat, analytics, social en marketingscripts moeten laden na de eerste gebruikersinteractie, niet tijdens het laden van de pagina.
- Stel niet-kritiek eigen JavaScript uit. Gebruik
deferofasyncop scripts die niet hoeven uit te voeren voordat de pagina interactief is. - Breek long tasks op. Als je eigen code functies heeft die langer dan 50ms duren, geef de main thread vrij zodat de browser gebruikersinvoer kan verwerken tussen werkblokken. De moderne manier is
scheduler.yield()(ondersteund in Chrome 129+ en Edge). Voor bredere browserondersteuning, val terug op het wrappen van werk insetTimeout(resolve, 0)binnen een Promise:async function yieldToMain() { if ('scheduler' in window && 'yield' in scheduler) { return scheduler.yield(); } return new Promise(resolve => setTimeout(resolve, 0)); } - Verwijder ongebruikt JavaScript. Gebruik de Coverage-tab van Chrome DevTools om JavaScript te identificeren dat laadt maar nooit wordt uitgevoerd. Verwijder het of laad het conditioneel.
Voor de volledige INP-optimalisatiestrategie, zie onze INP-optimalisatiegids.
Stap 6: Fix CLS
CLS is meestal de makkelijkste metriek om te fixen. De meest voorkomende oorzaken en oplossingen:
Afbeeldingen zonder dimensies
Elke <img>-tag heeft expliciete width- en height-attributen nodig. Zonder deze weet de browser niet hoeveel ruimte hij moet reserveren en verschuift de content wanneer de afbeelding laadt. Dit is de #1 oorzaak van CLS wereldwijd. Zie onze CLS-gids.
Wisselen van weblettertypen
Wanneer een weblettertype laadt en het fallback-lettertype vervangt, kan tekst opnieuw vloeien en omliggende elementen verschuiven. Fix: host lettertypen zelf, gebruik font-display: optional of gebruik de CSS size-adjust-eigenschap om de fallback-lettertypemetrieken af te stemmen op het weblettertype.
Dynamisch geïnjecteerde content
Cookiebanners, meldingsbalken, advertentieblokken en popups die content naar beneden duwen na het laden. Fix: reserveer ruimte voor deze elementen met CSS min-height of laad ze op een manier die de omliggende layout niet beïnvloedt (bijv. overlays in plaats van inline-injectie).
Stap 7: Verifieer met velddata
Na het implementeren van je fixes moet je verifiëren dat ze werken in de echte wereld, niet alleen in Lighthouse.
- Directe verificatie: gebruik CoreDash of een andere RUM-tool om realtime velddata te zien. Wijzigingen zouden binnen uren zichtbaar moeten zijn.
- CrUX-verificatie: de Chrome User Experience Report gebruikt een rollend venster van 28 dagen. Verwacht 2 tot 4 weken voordat verbeteringen volledig worden weergegeven in CrUX-data.
- Search Console-verificatie: het Core Web Vitals-rapport in Search Console wordt bijgewerkt op basis van CrUX. Zodra CrUX verbetering toont, volgt Search Console.
Deze vertraging is waarom RUM essentieel is. Zonder kun je pas weken later zien of je wijzigingen daadwerkelijk werkten.

Stap 8: Monitor en onderhoud
Prestaties verslechteren. Elke nieuwe plugin, thema-update of script van derden kan je werk ongedaan maken. Stel doorlopende monitoring in:
- Controleer wekelijks het Search Console Core Web Vitals-rapport
- Gebruik CoreDash voor continue realtime monitoring met waarschuwingen
- Test opnieuw in PageSpeed Insights na elke significante wijziging (nieuwe plugin, thema-update, nieuw script van derden)
- Audit scripts van derden elk kwartaal. Verwijder alles wat niet meer nodig is.
Voor een complete referentie van alles wat je zou moeten controleren, gebruik onze Ultieme Core Web Vitals Checklist.
Snelle winsten: de fixes met de grootste impact
Als je alleen tijd hebt voor vijf dingen, zijn dit de fixes met de grootste impact op alle platforms:
| Fix | Verbeterde metriek | Typische impact |
|---|---|---|
| Preload de LCP-afbeelding met fetchpriority="high" | LCP | 500ms tot 1500ms verbetering |
| Schakel paginacaching + CDN in | LCP (via TTFB) | 200ms tot 800ms verbetering |
| Stel scripts van derden uit tot interactie | INP | 50ms tot 300ms verbetering |
| Voeg width/height toe aan alle afbeeldingen | CLS | 0,05 tot 0,3 reductie |
| Host lettertypen zelf + font-display: optional | CLS + LCP | Elimineert lettertype-gerelateerde CLS, verbetert LCP 100ms tot 300ms |
Deze impactranges komen van CoreDash real user monitoring-data uit optimalisatieprojecten. Je daadwerkelijke verbetering hangt af van je startpunt, je hosting en je verkeersprofiel. Sites die beginnen met zeer slechte scores (LCP boven 5 seconden) zien vaak nog grotere verbeteringen. Sites die al dicht bij de drempel zitten kunnen kleinere absolute winsten zien, maar het verschil tussen falen en slagen.
De 2025 Web Almanac-data ondersteunen deze prioriteiten. Homepagina's halen Core Web Vitals op 45% op mobiel, terwijl secundaire pagina's slagen op 56%. Het verschil komt doordat homepagina's meer dynamische content, grotere hero-afbeeldingen en meer scripts van derden hebben. Als je homepage faalt maar interne pagina's slagen, richt je LCP- en INP-optimalisatie specifiek op de homepage-template.
Ik krijg sites door de Core Web Vitals.
500K+ pagina's voor grote Europese uitgevers en e-commerce. Ik schrijf de fixes en check ze in de echte data.
Zo werk ikVeelgestelde vragen over het halen van Core Web Vitals
Hoe lang duurt het om Core Web Vitals te halen na het doorvoeren van verbeteringen?
De CrUX-dataset (die Google gebruikt voor ranking) heeft een rollend venster van 28 dagen. Na het implementeren van fixes kun je 2 tot 4 weken verwachten voordat verbeteringen volledig worden weergegeven in CrUX-data en Google Search Console. De verandering is geleidelijk: naarmate nieuwe "goede" bezoeken zich ophopen en oude "slechte" bezoeken uit het venster verdwijnen, verbeteren je scores stapsgewijs. Om directe resultaten te zien, gebruik een Real User Monitoring-tool zoals CoreDash die realtime velddata toont.
Mijn Lighthouse-score is goed, maar Search Console toont falende Core Web Vitals. Waarom?
Lighthouse voert een enkele gesimuleerde bezoek uit onder gecontroleerde omstandigheden. Search Console gebruikt velddata van echte Chrome-gebruikers op echte apparaten en netwerken. Een bezoeker op een low-end Android-telefoon op 3G heeft een compleet andere ervaring dan de simulatie van Lighthouse. Velddata is wat Google gebruikt voor ranking, dus dat is waarvoor je moet optimaliseren. Het verschil tussen Lighthouse en velddata komt meestal door: echte gebruikers op tragere mobiele apparaten, geografische afstand tot je server, en scripts van derden die afvuren tijdens echte interacties maar niet tijdens een Lighthouse-test.
Moet ik Core Web Vitals halen op elke pagina?
Google evalueert Core Web Vitals op URL-niveau, valt dan terug op URL-groepniveau en origin-niveau data. Idealiter zou elke pagina moeten slagen. In de praktijk, richt je eerst op je pagina's met het meeste verkeer en je belangrijkste paginatemplates (homepage, productpagina's, landingspagina's, belangrijke blogposts). Een pagina die 10 bezoeken per maand krijgt heeft minder impact op je algehele sitebeoordeling dan een pagina die 10.000 bezoeken krijgt. Google Search Console groepeert URL's op probleemtype, dus het fixen van een probleem op één paginatemplate lost het vaak op voor alle pagina's die dat template gebruiken.
Wat is de meest voorkomende reden dat sites falen op Core Web Vitals?
LCP is de meest gefaalde metriek. Volgens de 2025 Web Almanac behaalt slechts 62% van de mobiele origins een goede LCP-score. De meest voorkomende oorzaken zijn: niet-geoptimaliseerde of lazy-geladen hero-afbeeldingen, trage serverresponstijden (hoge TTFB), renderblokkerende CSS en JavaScript, en afbeeldingen die via JavaScript worden geladen in plaats van vindbaar te zijn in de HTML-broncode. Het fixen van LCP heeft doorgaans de grootste algehele impact op je Core Web Vitals-slagingspercentage.
Zal het halen van Core Web Vitals mijn zoekrangschikking dramatisch verbeteren?
Core Web Vitals zijn een bevestigde Google-rankingfactor, maar contentrelevantie en autoriteit zijn veel belangrijker. Google heeft page experience beschreven als een tiebreaker: wanneer twee pagina's ongeveer gelijk zijn in contentkwaliteit, zal die met betere Core Web Vitals hoger ranken. Het halen van Core Web Vitals compenseert geen dunne content of zwakke backlinks. Echter, in competitieve niches waar veel sites vergelijkbare contentkwaliteit hebben, kunnen Core Web Vitals een meetbaar rankingvoordeel bieden. Het grotere voordeel is vaak indirect: snellere, meer responsieve sites hebben lagere bouncepercentages, hogere betrokkenheid en betere conversiepercentages.

