What is the Time To First Byte (TTFB) and how to improve it
What is the Time to First Byte, why it matters for your Core Web Vitals, and how to optimize it

Time to First Byte (TTFB) measures the time in milliseconds between the browser requesting a page and receiving the first byte of the response from the server. A good TTFB is 800 milliseconds or less at the 75th percentile. TTFB is not a Core Web Vital, but it is a critical diagnostic metric because it directly impacts both Largest Contentful Paint (LCP) and First Contentful Paint (FCP).
Table of Contents!
- What is the Time to First Byte
- TTFB is not a Core Web Vital
- Why is Time to First Byte important
- What is a good TTFB score?
- Real world impact: the T-Mobile case study
- The TTFB from request to response
- Technical stages of the Time To First Byte
- How to Measure the Time To First Byte (TTFB)
- Find bottlenecks with the Server-Timing API
- Speed up TTFB with 103 Early Hints
- Eliminate TTFB with the Speculation Rules API
- How does hosting affect the Time to First Byte?
- How to improve the TTFB: speed up the initial connection
- How to improve the TTFB: speed up the server side
- How to improve the TTFB: speed up the client side
- How to improve the TTFB: leverage a CDN
- How to improve the TTFB: avoid redirects
- Optimize resource prioritization alongside TTFB
- What real-world TTFB data shows
- Frequently Asked Questions about TTFB
- Related Deep Dives: TTFB Sub-Parts
What is the Time to First Byte
The Time to First Byte (TTFB) indicates how much time has elapsed in milliseconds between the start of the request and receiving the first response (byte) from a webpage. The TTFB is therefore also referred to as the waiting time. The TTFB is a way to measure the responsiveness of a web server and the network path between the user and that server. The TTFB is a foundational metric; this means that time added to the TTFB will also be added to the Largest Contentful Paint and the First Contentful Paint. Every millisecond saved on TTFB is a millisecond saved on both of these paint metrics.
TTFB is not a Core Web Vital
It is important to state this clearly: TTFB is not one of the three Core Web Vitals. The Core Web Vitals consist of Largest Contentful Paint (LCP), Interaction to Next Paint (INP), and Cumulative Layout Shift (CLS). Google does not use TTFB directly in its page experience ranking signals.
However, TTFB is classified as a diagnostic metric. It helps you understand why your LCP or FCP might be slow. According to the HTTP Archive Web Almanac 2024, sites with poor LCP spend an average of 2.27 seconds on TTFB alone, which nearly exhausts the entire 2.5 second LCP threshold before the browser even begins to render the page. Fixing TTFB is therefore one of the most impactful things you can do for your overall Core Web Vitals scores.
Why is Time to First Byte important
The Time to First Byte is not a Core Web Vital and it is very possible to pass the Core Web Vitals while failing the TTFB metric. That does not mean that the TTFB is not important. The TTFB is an extremely important metric to optimize and fixing the TTFB will greatly improve pagespeed and the page experience.
The impact of TTFB for visitors
The Time to First Byte precedes all other paint metrics. While the browser is waiting for the Time to First Byte, it cannot do anything and will just show a blank screen. This means that any increase in Time to First Byte will result in extra "blank screen" time and any decrease in the Time to First Byte will translate into less "blank screen" time.
To get that feeling of instant loading pages, the Time to First Byte needs to be as fast as possible.
Why is the TTFB not a Core Web Vital? TTFB does not account for rendering: a low TTFB does not necessarily mean a good user experience because it does not consider the time it takes for the browser to render the webpage. Even if all the bytes are downloaded quickly, the webpage could still take a long time to display if the browser needs to process a lot of JavaScript or render complex layouts.
What is a good TTFB score?

It is recommended that your server responds to navigation requests quickly enough so that the 75th percentile of users experience an FCP within the "good" threshold. As a rough guide, most sites should strive to have a TTFB of 0.8 seconds or less.
- A TTFB below 800 milliseconds is considered good.
- A TTFB between 800 and 1800 milliseconds needs improvement.
- A TTFB over 1800 milliseconds is considered poor and should be improved immediately.
Real world impact: the T-Mobile case study
T-Mobile invested heavily in reducing their Time to First Byte as part of a broader performance optimization initiative. The results were striking: a 60% increase in visit-to-order conversions. By moving to edge-rendered pages and aggressive server side caching, T-Mobile dramatically reduced the time users spent waiting for the first byte, which cascaded into faster LCP, faster FCP, and a measurably better user experience. This case study demonstrates that TTFB optimization is not just a technical exercise; it directly affects business outcomes.
The TTFB from request to response
From Browser to Server: The Request
The browser request time is the time elapsed from the moment a user's browser sends an HTTP request until that request reaches the server hosting the website. The TTFB of this part is largely beyond the direct control of the website and depends heavily on:
- The user's internet speed.
- The quality of their network infrastructure.
- The physical distance between the user and the server.
Within this stage, DNS lookup, browser start-up time, browser cache lookups and negotiating the connection to the server (TCP and TLS) all take up a bit of time.
On the Server: Processing and Preparing the Response
Once the server receives the request, the clock is ticking as it works to generate a response. This stage is what most developers tend to focus on and where optimization efforts can have the most significant impact. Factors to consider include:
- Server Capabilities: Powerful hardware (CPU, RAM), efficient software (web server, database), and optimized configurations all matter.
- Database Duration: If the request requires fetching data from a database, slow queries can be a major bottleneck.
- Code Optimization: Poorly written server-side code (e.g., inefficient scripts) can lead to long processing times.
- Caching Strategies: Effective caching (like server-side caching or using a Content Delivery Network) can drastically reduce processing burden for repeat requests.
Back to the Browser: Delivering the First Byte
After processing, the server sends the response, beginning with the first byte, back to the user's browser.
- Similar to the first stage, network conditions and distance play a role here too.
- CDNs are particularly beneficial in this stage as they cache content closer to users, minimizing travel time.
- Redirects are served at this point, which makes the process repeat itself with an extra delay.
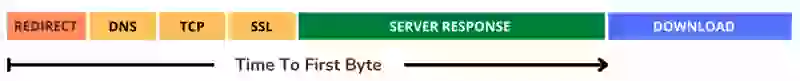
Technical stages of the Time To First Byte
Similar to the "request to response path" in your browser, the Time To First Byte of navigation requests can be measured with the Navigation Timing API and broken down into 5 sub-parts.
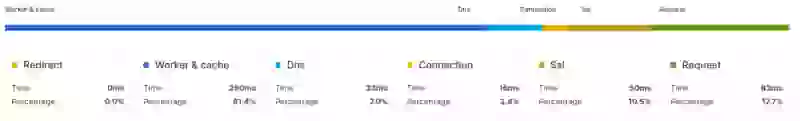
- Redirect time: when a resource has been moved to a new location the redirect time gets added to the resource's TTFB.
- Worker and Cache time: before a resource is fetched from the internet a browser will first try to look it up in its own cache or via a worker (if a worker has been set up).
- DNS lookup time: Next a browser might need to perform a DNS lookup to translate the domain name (www.example.com) into an IP address.
- TCP connect time: Then the browser will connect to the server and perform a few checks.
- SSL handshake: Then the browser and the server will encrypt their communication.
- Server response: Finally the server needs to send the HTML. It might need to generate the HTML first.
How to Measure the Time To First Byte (TTFB)
PageSpeed TIP: every resource has its own Time to First Byte. In this context however we are talking about the Time to First Byte of the main page.
The Time to First Byte can greatly fluctuate between different users with different devices and from different locations. That is why self-measuring the Time to First Byte from your desktop computer is probably not a great idea. Using tools like Pingdom or GTMetrix is not reliable for the same reason.
The best way to measure the Time To First Byte is to collect Real User Metrics (RUM) data from your visitors. You can do this yourself with the code below or use a RUM tool like CoreDash.
Measure TTFB with synthetic tools
- KeyCDN's Web Performance Test: This online tool allows you to quickly measure TTFB from 14 different testing locations worldwide.
- GTmetrix: This tool refers to TTFB as "waiting" time. To see your results, scan your site with GTmetrix and open the waterfall chart. Hovering over the first result will show you the site's loading metrics, including TTFB.
- WebPageTest: This tool displays your TTFB in seconds after you scan your site.
- Pingdom: Like GTmetrix, this tool refers to TTFB as "wait" time. To find your wait times, scan your site with Pingdom, and scroll down to the "File Requests" section, where you will see wait times for both your site and individual requests.
- Geekflare's TTFB tool: This tool allows you to quickly determine your TTFB from three global locations.
- Sematext Synthetics: To use this tool, you will need to create a browser monitor and provide the URL of the website you want to track. Sematext Synthetics lets you monitor websites from different geographic locations using the device of your choice.
- Lighthouse: You can find the server response time in the "Performance" section of Lighthouse reports. You may need to click on the "Passed Audits" heading to see it.
Measure TTFB with RUM tracking
Measure TTFB with CrUX data
CrUX (Chrome User Experience Report) is a publicly available dataset by Google that contains real-world performance data for websites. Google uses the CrUX dataset to determine whether or not you are passing the Core Web Vitals.
The CrUX dataset can be accessed through tools like PageSpeed Insights, the CrUX API, Looker Studio or Google BigQuery. Use any of these tools to get the TTFB for your site.
Measure TTFB with JavaScript
To measure the Time to First Byte (TTFB) with JavaScript, you can use the Navigation Timing API. You can create a PerformanceObserver that listens for a navigation entry and logs the responseStart property to the console. The responseStart property represents the timestamp when the first byte of the response was received. The web-vitals JavaScript library provides a more concise way to measure TTFB in the browser using the onTTFB function.
The code below can be used to measure the Time To First Byte (TTFB):
const formatTime = (time) => {
//round by 2 decimals, use Math.round() for integer
return Math.round(time * 100) / 100;
};
new PerformanceObserver((entryList) => {
const [pageNav] = entryList.getEntriesByType('navigation');
// timing start times are relative
const activationStart = pageNav.activationStart || 0;
const workerStart = Math.max(pageNav.workerStart - activationStart, activationStart);
const dnsStart = Math.max(pageNav.domainLookupStart - activationStart, workerStart);
const tcpStart = Math.max(pageNav.connectStart - activationStart, dnsStart);
const sslStart = Math.max(pageNav.secureConnectionStart - activationStart, tcpStart);
const requestStart = Math.max(pageNav.requestStart - activationStart, sslStart);
const responseStart = Math.max(pageNav.responseStart - activationStart, requestStart);
// attribution based on https://www.w3.org/TR/navigation-timing-2/#processing-model
// use associative array to log the results more readable
let attributionArray = [];
attributionArray['Redirect Time'] = { 'time in ms': formatTime(workerStart - activationStart) };
attributionArray['Worker and Cache Time'] = { 'time in ms': formatTime(dnsStart - workerStart) };
attributionArray['DNS Time'] = { 'time in ms': formatTime(tcpStart - dnsStart) };
attributionArray['TCP Time'] = { 'time in ms': formatTime(sslStart - tcpStart) };
attributionArray['SSL Time'] = { 'time in ms': formatTime(requestStart - sslStart) };
attributionArray['Request Time'] = { 'time in ms': formatTime(responseStart - requestStart) };
attributionArray['Total TTFB'] = { 'time in ms': formatTime(responseStart - activationStart) };
// log the results
console.log('%cTime to First Byte (' + formatTime(responseStart - activationStart) + 'ms)', 'color: blue; font-weight: bold;');
console.table(attributionArray);
console.log('%cOrigininal navigation entry', 'color: blue; font-weight: bold;');
console.log(pageNav);
}).observe({
type: 'navigation',
buffered: true
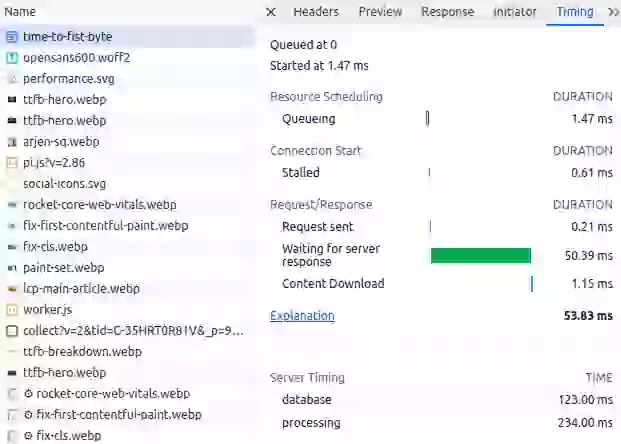
}); Find bottlenecks with the Server-Timing API
The Server-Timing API provides a standardized way to send backend server performance timings to the browser. By utilizing Server-Timing headers, developers can effectively measure and analyze the server side components contributing to TTFB, helping identify areas for optimization and improving overall website performance.
The Server-Timing header can contain timings for multiple metrics separated by commas. Each entry consists of:
- A short name for the metric (such as
databaseandprocessing) - A duration in milliseconds (expressed as
dur=123) - An optional description (expressed as
desc="My Description")
Server-Timing: database;dur=123;desc="DB Query", processing;dur=234;desc="Template Render", cache;dur=0;desc="Cache HIT"
Reading Server-Timing in Chrome DevTools
Chrome DevTools displays Server-Timing entries directly in the Network panel. Open DevTools, select the document request in the Network tab, scroll down to the "Server Timing" section in the Timing tab. Each metric you send via the Server-Timing header will appear with its name, description, and duration. This makes it simple to identify whether your database, template rendering, or caching layer is the bottleneck.
You can also read the Server-Timing header programmatically and send these timings to your favorite RUM tool like CoreDash for long-term tracking and alerting.
Speed up TTFB with 103 Early Hints
103 Early Hints is an HTTP status code that allows the server to send preliminary response headers to the browser before the final response is ready. While the server is still processing the request (querying the database, rendering the template), the browser can already start loading critical resources such as stylesheets, fonts, and the LCP image.
How 103 Early Hints works
In a traditional request flow, the browser sits idle during the entire server processing time. With 103 Early Hints, the server sends a partial response immediately after receiving the request. This partial response contains Link headers that tell the browser which resources to preload or preconnect to. The browser acts on these hints while it waits for the full 200 response.
This effectively turns dead waiting time into productive loading time. While 103 Early Hints does not reduce the TTFB of the document itself, it reduces the perceived impact of TTFB on subsequent metrics like LCP and FCP by giving the browser a head start on resource discovery.
Server configuration example for 103 Early Hints
Many CDNs and web servers now support 103 Early Hints. Here is an example using Cloudflare, which automatically generates 103 Early Hints from Link headers and preload/preconnect tags found in your HTML:
HTTP/1.1 103 Early Hints
Link: </style.css>; rel=preload; as=style
Link: </static/img/hero.webp>; rel=preload; as=image
Link: <https://fonts.googleapis.com>; rel=preconnect

HTTP/1.1 200 OK
Content-Type: text/html
...
For Nginx, you can configure Early Hints by adding Link headers to your response and enabling HTTP/2 or HTTP/3 push. Apache supports 103 Early Hints through the H2EarlyHints directive. Check our detailed guide on implementing 103 Early Hints for step-by-step instructions.
Eliminate TTFB with the Speculation Rules API
The Speculation Rules API is designed to improve performance for future navigations. Once a visitor has landed on your page you can use Speculation Rules to instruct a browser to fetch (with the prefetch directive) or even fully render (with the prerender directive) pages that the visitor is most likely to visit next.
How Speculation Rules eliminates TTFB
When a page is prerendered, the browser loads and renders it completely in a hidden tab. When the user then clicks the link, the prerendered page is swapped in instantly. The result: a measured TTFB of 0 milliseconds. This is not a theoretical number. CoreDash RUM data from corewebvitals.io confirms that prerendered navigations via Speculation Rules show a p75 TTFB of 0ms.
Prefetching is a lighter alternative. Instead of fully rendering the page, the browser only fetches the HTML document and caches it. This eliminates the network portion of TTFB while still requiring the browser to parse and render the document upon navigation.
Speculation Rules JSON syntax
Speculation Rules are defined using a <script type="speculationrules"> block containing JSON. Here is an example that prerenders all navigation links in your menu bar with "moderate" eagerness (triggered on hover or pointer down):
<script type="speculationrules">
{"prerender":
[{
  "source": "document",
  "where": {"selector_matches": "nav a"},
  "eagerness": "moderate"
}]}
</script>
You can also use a list-based approach for specific URLs:
<script type="speculationrules">
{"prefetch":
[{
  "source": "list",
  "urls": ["/core-web-vitals/", "/pagespeed/103-early-hints"]
}]}
</script>
Browser support for Speculation Rules is growing. Chrome 121+ supports the full API including document rules. For browsers that do not yet support Speculation Rules, you could use a lightweight script like quicklink as a fallback. Use our Speculation Rules Generator to create the right configuration for your site.
How does hosting affect the Time to First Byte?
Hosting affects the Time to First Byte in multiple ways. By investing in better hosting it is usually possible to immediately improve the Time to First Byte without changing anything else. Especially when switching from low-budget shared hosting to properly configured and managed virtual servers, the TTFB could drastically improve.
Hosting TIP: better hosting involves faster processing, better network speed and more and faster server memory. Expensive hosting does not always equal better hosting. Many upgrades on shared hosting services only get you more storage, not more CPU power.
I do not recommend switching hosting without knowing the root causes of TTFB issues. I advise you to set up RUM tracking and add Server-Timing headers.
When you upgrade your hosting you should generally look for at least one of these three improvements:
- Get more resources (CPU + RAM): Especially when it takes the server too long to generate the dynamic HTML.
- Faster DNS: Many low budget hosting providers are notorious for their poor DNS performance.
- Better configuration: Look for faster SSL ciphers, HTTP/3, Brotli compression, and access to the webserver configuration (to disable unneeded modules) to name a few.
How to improve the TTFB: speed up the initial connection
A high Time to First Byte can have multiple causes. However DNS, TCP and SSL affect all Time to First Bytes. So let us start there. Even though optimizing these three may not yield the biggest results, optimizing these will optimize every single TTFB.
Speed up DNS
PageSpeed TIP: DNS, TCP and SSL are usually a bigger issue when you are using a cheap host or when you serve a global audience while not using a CDN. Use RUM tracking to view your global TTFB and break down the TTFB into its sub-parts.
Use a fast DNS provider. Not all DNS providers are as fast as others. Some (free) DNS providers are just slower than other (free) DNS providers. Cloudflare for example will give you one of the world's fastest DNS providers for free.
Increase the DNS TTL. Another way is to increase the Time to Live (TTL) value. TTL is a setting that determines how long the lookup can be cached. The higher the TTL, the less likely the browser will need to perform another DNS lookup. It is important to note that ISPs also cache DNS.
Speed up TCP
The "TCP part" of the TTFB is the initial connection to the webserver. When connecting, the browser and the server share information about how data will be exchanged. You can speed up TCP by connecting to a server that is geographically close to your location and by ensuring the server has enough free resources. Sometimes changing to a lightweight server like NGINX can speed up the TCP part of the TTFB. In many cases using a CDN will speed up the TCP connection.
Speed up SSL/TLS
Once the TCP connection has been made the browser and the server will need to secure the connection through encryption. You can speed this up by using faster, newer and more lightweight protocols (SSL ciphers) and by being geographically closer to your webserver (since the TLS negotiation takes quite a few back and forth round-trips). Using a CDN will often improve the SSL connection time since CDNs are often very well configured and have multiple servers all across the globe. TLS 1.3 in particular is designed to keep TLS negotiation as short as possible.
How to improve the TTFB: speed up the server side
Page Caching
By far the most efficient way to speed up the Time to First Byte is to serve the HTML from the server cache. There are several ways to implement full page caching. The most effective way is by doing this directly at the web-server level with, for example, the NGINX caching module or by using Varnish as a reverse caching proxy.
There also are a lot of plugins for different CMS systems that will cache full pages and many SPA frameworks like Next.js have their own implementation of full page caching along with different invalidation strategies.
If you would like to implement your own caching, the basic idea is simple. When a client requests a page, check if it exists in the cache folder. If it does not exist, create the page, write it to cache and show the page like you normally would. On any next request to the page the cache file will exist and you can serve the page directly from cache.
Partial caching
With partial caching the idea is to cache frequently used, slow or expensive parts of the page or resources (like API calls, database results) for fast retrieval. This will eliminate bottlenecks when generating a page. If you are interested in these types of optimizations you should look up these concepts: Memory Cache, Object Cache, Database Cache, Object-Relational Mapping (ORM) Cache, Content Fragment Cache and Opcode Cache.
Optimize the application code
Sometimes the page cannot be served from (partial) cache because the cache file does not exist, large parts of the pages are dynamic or because you run into other issues. That is why we need to optimize the application code. How this is done depends entirely on your application. It is based on re-writing and optimizing slow parts of your code.
Optimize database queries
Most of the time ineffective database queries are the root cause of a slow Time to First Byte. Start by logging "slow queries" and "queries not using indexes" to disk. Analyze them, add indexes or ask an expert to perform database tuning to fix these issues. See MongoDB Performance Advisor and MySQL Slow Query Log for more details.
Reduce internal network latency
A bad practice that I come across more times than I would like is a delay in Time to First Byte caused by slowness in communication between the web application and the data storage. This usually only happens with large sites that have outsourced their data storage to cloud APIs.
How to improve the TTFB: speed up the client side
Client side caching
Client-side caching involves the user's browser storing resources that they have already accessed, like images and scripts. So when the user comes back to your website, their browser can quickly retrieve the cached resources instead of having to download them again. This can significantly reduce the number of requests made to the server, which in turn can reduce the TTFB.
To implement client-side caching, you can use the HTTP Cache-Control header. This header allows you to specify how long the browser should cache a particular resource.
You could consider completely caching the HTML of the page on the client side. This will dramatically reduce the TTFB since no server request is needed. The downside is that once the page is in the browser's cache, any updates on the live version of the page will not be seen by the user until the page cache expires.
Service Workers
Service workers are scripts that run in the background of a user's browser and can intercept network requests made by the browser. This means that service workers can cache resources like HTML, images, scripts, and stylesheets, so that when the user comes back to your website, their browser can quickly retrieve the cached resources instead of having to download them again.
Page Prefetching
If you do not want to use the Speculation Rules API because of its limited browser support, you could use a small script called quicklink. This will prefetch all the links in the visible viewport and all but eliminate the Time To First Byte for these links.
The downside to quicklink is that it requires more browser resources, but for now it will outperform the Speculation Rules API in terms of browser coverage.
How to improve the TTFB: leverage a CDN
A Content Delivery Network or CDN uses a distributed network of servers to deliver resources to users. These servers are usually geographically closer to end users and highly optimized for speed. If you are using Cloudflare, check our guide on how to configure Cloudflare for optimal Core Web Vitals performance.

A CDN can help improve 5 out of 6 parts of the Time to First Byte:
- Redirect time: Most CDNs can cache redirects on the edge or use edge workers to handle redirects without the need to connect to the origin server.
- DNS lookup time: Most CDNs offer extremely fast DNS servers that will probably outperform your current DNS servers.
- TCP connect and SSL Handshake time: Most CDNs are configured extremely well and these configurations, along with the closer proximity to the end users, will speed up connect and handshake time.
- Server response: CDNs can speed up server response time in a couple of ways. The first is by caching the server response on the edge (full page edge caching) but also by offering excellent compression (Brotli) and the newest (HTTP/3) protocols.
How to improve the TTFB: avoid redirects
Redirect time is added to the Time To First Byte. Therefore, as a general rule, avoid redirects as much as possible. Redirects can happen when a resource is no longer available in one location but has moved to another location. The server will respond with a redirect response header and the browser will try that new location.
Same origin redirects. Same-origin redirects originate from links on your own website. You should have full control over these links and you should prioritize fixing these links when working on the Time to First Byte. There are a lot of tools out there that will let you check your entire website for redirects.
Cross-origin redirects. Cross-origin redirects originate from links on other websites. You have very little control over these.
Multiple redirects. Multiple redirects or redirect chains occur when a single redirect does not redirect to the final location of the resource. These types of redirects put more of a strain on the Time to First Byte and should be avoided at all costs. Again, use a tool to find these types of redirects and fix them.
HTTP-to-HTTPS redirects. One way you can get around this is to use the Strict-Transport-Security header (HSTS), which will enforce HTTPS on the first visit to an origin, and then will tell the browser to immediately access the origin through the HTTPS scheme on future visits.
When a user requests a web page, the server may respond with a redirect to another page. This redirect can add additional time to the TTFB because the browser must make an additional request to the new page.
There are several ways to avoid redirects or minimize the impact of redirects:
- Update your internal links. Whenever you change the location of a page, update your internal links to that page to ensure no references to the earlier page location remain.
- Handle redirects on the server level.
- Use relative URLs: When linking to pages on your own website, use relative URLs instead of absolute URLs. This will help prevent unnecessary redirects.
- Use canonical URLs: If you have multiple pages with similar content, use a canonical URL to indicate the preferred version of the page. This will help prevent duplicate content and unnecessary redirects.
- Use 301 redirects: If you must use a redirect, use a 301 redirect instead of a 302 redirect. A 301 redirect is a permanent redirect, while a 302 redirect is a temporary redirect. Using a 301 redirect will help prevent unnecessary redirects.
Optimize resource prioritization alongside TTFB
Reducing TTFB is only part of the loading performance story. Once the first byte arrives, the browser needs to know which resources to prioritize. Read our guide to resource prioritization to learn how fetchpriority, preload, and preconnect hints work together with a fast TTFB to deliver the fastest possible page loads. Additionally, consider self-hosting your Google Fonts to eliminate third-party DNS lookups and connection times that add to your users' perceived TTFB.
What real-world TTFB data shows
The following data comes from CoreDash Real User Monitoring and the HTTP Archive Web Almanac 2024 (CrUX data, June 2024).
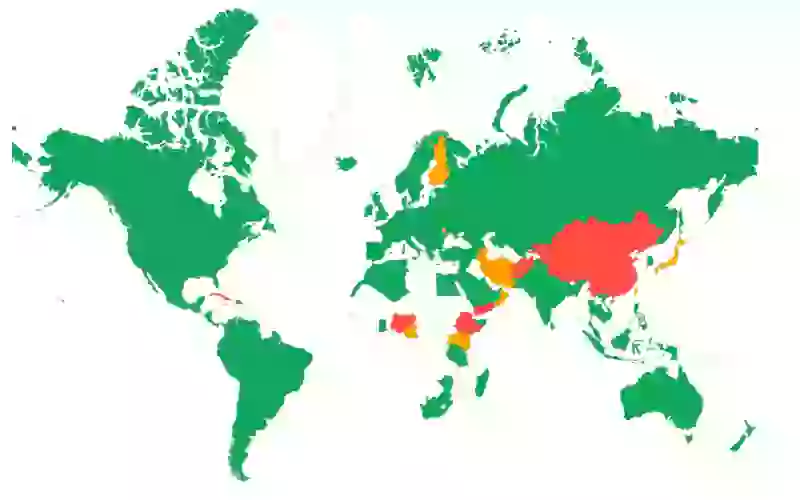
Geographic variation is enormous
TTFB varies dramatically based on the physical distance between the user and the server. CoreDash data from corewebvitals.io (hosted in Europe) illustrates this clearly:
| Country | p75 TTFB | Good % |
|---|---|---|
| Czech Republic | 62ms | 98.8% |
| Netherlands | 106ms | 97.0% |
| Germany | 138ms | 98.5% |
| United Kingdom | 169ms | 97.7% |
| United States | 284ms | 92.7% |
| India | 404ms | 88.2% |
| China | 1,468ms | 26.6% |
European users near the server see TTFB under 170ms, while users in India experience 3x higher TTFB and users in China see nearly 10x higher TTFB (1,468ms) due to the Great Firewall and the sheer physical distance. This data demonstrates why a CDN with global edge locations is essential for international audiences.
Speculation Rules prerender delivers 0ms TTFB
CoreDash navigation type data confirms that pages prerendered via Speculation Rules achieve a p75 TTFB of 0 milliseconds. Standard navigations measure 131ms, reloads come in at 82ms (benefiting from warm connections), and back-forward navigations are the slowest at 244ms. This makes Speculation Rules the single most effective technique for eliminating TTFB on subsequent page loads.
Mobile TTFB is 2.5x desktop
On corewebvitals.io, mobile users experience a p75 TTFB of 316ms compared to 124ms on desktop. This 2.5x gap is caused by mobile network latency, not by server differences. Only 88.5% of mobile page loads achieve a "good" TTFB rating compared to 96.1% on desktop. When optimizing for TTFB, always test on real mobile networks.
New vs. repeat visitors see similar TTFB
On this site, new visitors see a p75 TTFB of 127ms while repeat visitors see 138ms. The similarity suggests that consistent server-side caching (rather than client-side cache advantages) is the primary factor in TTFB performance. On sites without server-side caching, the gap between new and repeat visitors can be much larger.
Global TTFB has stalled for 5 years
According to the HTTP Archive Web Almanac 2024, only 42% of mobile pages achieve a "good" TTFB score globally. This number has barely changed from 41% in 2021, making TTFB the most stagnant performance metric on the web. Meanwhile, LCP improved from 44% to 59% and INP from 55% to 74% over the same period. Sites with poor LCP spend an average of 2.27 seconds on TTFB alone, nearly the entire 2.5 second LCP threshold.
Frequently Asked Questions about TTFB
What is a good TTFB?
A good Time to First Byte is 800 milliseconds or less at the 75th percentile. This means that 75% of your users should receive the first byte of the response within 800ms. A TTFB between 800ms and 1,800ms needs improvement, and a TTFB over 1,800ms is considered poor. Note that these thresholds apply to the full navigation TTFB, including DNS, TCP, TLS, and server processing time.
Is TTFB a Core Web Vital?
No, TTFB is not a Core Web Vital. The three Core Web Vitals are Largest Contentful Paint (LCP), Interaction to Next Paint (INP), and Cumulative Layout Shift (CLS). TTFB is classified as a diagnostic metric. It is not directly used in Google's page experience ranking signals, but it has a major indirect impact because a slow TTFB directly increases both LCP and FCP. Optimizing TTFB is often the fastest way to improve your Core Web Vitals scores.
How does a CDN reduce TTFB?
A CDN (Content Delivery Network) reduces TTFB in several ways. First, it places servers geographically closer to your users, which reduces network latency for DNS lookups, TCP connections, and TLS handshakes. Second, a CDN can cache your pages on edge servers so the response can be served without connecting to your origin server at all. Third, CDNs typically offer highly optimized configurations including HTTP/3, Brotli compression, and fast TLS negotiation. CoreDash data shows that users close to the server (Czech Republic: 62ms) experience dramatically lower TTFB than distant users (India: 404ms, China: 1,468ms).
What is the difference between TTFB and server response time?
Server response time measures only the time the server spends processing the request and generating the response. TTFB includes server response time plus all the network overhead: DNS resolution, TCP connection, TLS handshake, and the network transit time for both the request and the first byte of the response. A site can have fast server response time (measured via the Server-Timing API) but still have a slow TTFB if the user is far from the server or on a slow network. When debugging TTFB issues, it is important to break the metric into its sub-parts to determine whether the problem is server-side or network-side.
Why is my TTFB high for some countries?
TTFB varies by country because of physical distance, network infrastructure quality, and internet routing. Each sub-part of TTFB (DNS, TCP, TLS, server response) is affected by the round-trip time between the user and the server. A user in India connecting to a server in Germany will experience multiple round-trips across thousands of kilometers, each adding latency. Countries with less developed internet infrastructure or restrictive firewalls (like China) experience even higher TTFB. The solution is to use a CDN that caches your content on edge servers close to your users, or to deploy your application in multiple regions.
Related Deep Dives: TTFB Sub-Parts
Each sub-part of the Time to First Byte has its own optimization strategies. Explore these deep dives for targeted guidance:
- Fix and Identify TTFB Issues: A step-by-step diagnostic guide to finding the root cause of slow TTFB using DevTools, Server-Timing, and RUM data.
- Reduce the Waiting Duration: How to minimize redirect time and server processing delays that add to your TTFB.
- Reduce the Cache Duration: Strategies for browser caching, service workers, and back/forward cache (bfcache) to eliminate TTFB for returning visitors.
- Minimize DNS Duration: How to speed up DNS resolution with faster DNS providers, increased TTL values, and
dns-prefetchresource hints. - Optimize Connection Duration (TCP + TLS): Reducing TCP and TLS handshake time with HTTP/3, TLS 1.3, session resumption, and
preconnecthints.
Your dev team is busy.
Delegate the performance architecture to a specialist. I handle the optimization track while your team ships the product.
- Parallel Workflows
- Specialized Expertise
- Faster Delivery

