Interaction to Next Paint (INP): O Que É, Como Medir e Melhorar
O guia completo para entender, medir e otimizar o Interaction to Next Paint, a Core Web Vital que mede a responsividade da página

Interaction to Next Paint (INP) é uma Core Web Vital que mede a rapidez com que uma página web responde às interações do usuário, como cliques, toques e pressionamentos de tecla. O INP captura a latência total desde a entrada do usuário, passando pelo processamento JavaScript, até a atualização visual final na tela. Uma boa pontuação de INP é de 200 milissegundos ou menos no percentil 75. O INP substituiu o First Input Delay (FID) como Core Web Vital em março de 2024.
Table of Contents!
- O que é Interaction to Next Paint (INP)?
- INP vs FID: O Que Mudou e Por Quê
- Quais Interações o INP Mede?
- As Três Fases de uma Interação INP
- Quais São Boas e Ruins Pontuações de INP?
- Como Medir o Interaction to Next Paint (INP)
- Como Melhorar o Interaction to Next Paint
- Depurando INP com a API Long Animation Frames (LoAF)
- Estudos de Caso: Melhorias de INP em Produção
- O Que os Dados Reais Mostram Sobre INP
- Perguntas Frequentes
- Guias Relacionados
O que é Interaction to Next Paint (INP)?
Interaction to Next Paint (INP) é uma métrica Core Web Vital que mede a responsividade de uma página web durante toda a visita do usuário. Ao contrário do seu antecessor First Input Delay (FID), que apenas media o atraso antes do início do manipulador de eventos da primeira interação, o INP avalia todas as interações que um usuário faz com a página e reporta um único valor que representa a responsividade geral da página.
Toda vez que um usuário clica em um botão, toca em um link, pressiona uma tecla no teclado ou interage com um controle personalizado, o navegador mede o tempo total desde o momento da entrada até quando o próximo frame é pintado na tela. O INP seleciona uma das interações mais lentas como a pontuação de responsividade da página. Para páginas com menos de 50 interações totais, o INP reporta a pior interação. Para páginas com muitas interações, o INP normalmente usa o percentil 98 para filtrar outliers ocasionais.
Um INP baixo significa que a página responde de forma confiável à entrada do usuário em tempo hábil. Um INP alto significa que a página parece lenta, não responsiva ou "travada" porque o navegador não consegue processar as interações e atualizar a tela com rapidez suficiente.
INP vs FID: O Que Mudou e Por Quê
O INP substituiu oficialmente o First Input Delay (FID) como Core Web Vital em março de 2024. O Google aposentou o FID porque ele tinha duas limitações fundamentais que o tornavam uma medida incompleta da responsividade da página.
Primeiro, o FID só media a primeira interação em uma página. Se o primeiro clique de um usuário fosse rápido, mas as interações subsequentes fossem lentas, o FID reportaria uma pontuação aprovada apesar da experiência ruim. O INP mede todas as interações durante a sessão, fornecendo um retrato muito mais preciso da responsividade real.
Segundo, o FID só media a fase de input delay, ou seja, capturava o tempo que o navegador gastava esperando antes de começar a processar o evento. Ele ignorava completamente o tempo gasto executando o código do manipulador de eventos (processing time) e o tempo necessário para pintar o resultado visual na tela (presentation delay). O INP captura todas as três fases, dando aos desenvolvedores uma visão completa da latência da interação.
| Aspecto | First Input Delay (FID) | Interaction to Next Paint (INP) |
|---|---|---|
| Status | Aposentado (Março 2024) | Core Web Vital Ativa |
| Interações medidas | Apenas a primeira interação | Todas as interações durante a sessão |
| Fases capturadas | Apenas input delay | Input delay + processing time + presentation delay |
| Limiar "Bom" | 100ms | 200ms |
| Método de reporte | Pior valor único | Percentil 98 (ou pior se menos de 50 interações) |
A transição do FID para o INP causou uma queda de aproximadamente 5 pontos percentuais nas taxas de aprovação das Core Web Vitals em dispositivos móveis, de acordo com o HTTP Archive 2025 Web Almanac. Isso aconteceu porque muitos sites que pareciam responsivos sob o FID tinham interações posteriores lentas que o INP agora captura.
Quais Interações o INP Mede?
O INP mede apenas interações que envolvem entrada discreta do usuário que o navegador pode observar através de manipuladores de eventos. Entender quais interações contam é essencial para depuração e otimização precisas.
Interações que contam para o INP
- Cliques do mouse (incluindo cliques em botões, links, caixas de seleção e controles personalizados)
- Toques em telas sensíveis ao toque (equivalentes a cliques em dispositivos móveis)
- Pressionamentos de tecla em um teclado físico ou virtual (incluindo digitação em campos de formulário, pressionar Enter, usar atalhos de teclado)
Interações que NÃO contam para o INP
- Rolagem não conta porque é tratada pela thread do compositor do navegador e normalmente não bloqueia a thread principal
- Hover (mouseover) não conta porque é um estado contínuo do ponteiro, não uma interação discreta do usuário
- Gestos de arrastar não contam, embora o pointerdown inicial que inicia um arrasto possa acionar uma entrada de INP
- Transições e animações CSS que ocorrem sem entrada do usuário não são interações
Um equívoco comum é que a rolagem afeta o INP. Não afeta. No entanto, se sua página usa rolagem baseada em JavaScript em vez de rolagem nativa do navegador, esses manipuladores de scroll JavaScript podem acionar callbacks de eventos que o navegador mede como interações. Esta é uma das razões pelas quais a rolagem CSS nativa supera consistentemente a rolagem JavaScript em responsividade.
As Três Fases de uma Interação INP
Cada interação medida pelo INP consiste em três fases sequenciais. O valor total do INP é a soma das três. Entender cada fase é fundamental porque a estratégia de otimização difere para cada uma.
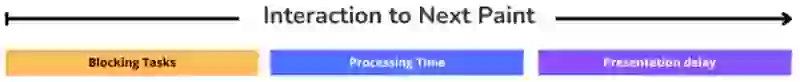
1. Input Delay
O input delay é o tempo entre quando o usuário interage com a página e quando o navegador começa a executar os manipuladores de eventos associados. Esse atraso ocorre porque a thread principal do navegador pode estar ocupada com outro trabalho, como analisar JavaScript, executar tarefas previamente agendadas ou processar outros callbacks de eventos.
O input delay é especialmente problemático durante a fase de carregamento da página, quando muitos scripts estão sendo analisados e executados simultaneamente. Dados do CoreDash mostram que interações durante a fase de carregamento têm um INP p75 de 132ms, comparado a apenas 50ms para interações após o carregamento completo da página. Isso é uma diferença de 2,6x. Reduzir a contenção da thread principal durante a inicialização da página é uma das maneiras mais eficazes de melhorar o INP.
Na mediana, o input delay é a menor sub-parte do INP. Mas no percentil 90, o input delay se torna o contribuinte dominante porque tarefas longas na thread principal podem atrasar o processamento de eventos em centenas de milissegundos. O HTTP Archive 2025 Web Almanac descobriu que menos de 25% dos sites mantêm a duração das tarefas abaixo do limiar recomendado de 50ms.
2. Processing Time
O processing time é o tempo total que o navegador gasta executando todos os callbacks dos manipuladores de eventos associados à interação. Isso inclui qualquer JavaScript que executa em resposta ao evento, desde validação de formulários até atualizações de estado e chamadas de rastreamento de analytics.
O processing time responde por uma parte significativa do INP total. Se um manipulador de eventos realiza operações DOM caras, faz chamadas de API síncronas ou executa loops ineficientes, o processing time vai inflar. Um padrão comum que infla o processing time é executar código não essencial (como eventos de analytics ou callbacks de tags de terceiros) dentro do mesmo manipulador de eventos que a atualização visual crítica.
3. Presentation Delay
O presentation delay é o tempo entre quando todos os manipuladores de eventos terminaram de executar e quando o navegador apresenta o próximo frame contendo a atualização visual. Esta fase inclui recálculo de estilos, computação de layout, pintura e composição.
Na mediana, o presentation delay é a maior sub-parte do INP porque toda interação requer pelo menos uma passagem de renderização. Páginas com um DOM grande ou profundamente aninhado levam mais tempo para recalcular estilos e realizar o layout. Aplicações de Página Única que re-renderizam grandes árvores de componentes após mudanças de estado são particularmente suscetíveis a alto presentation delay.
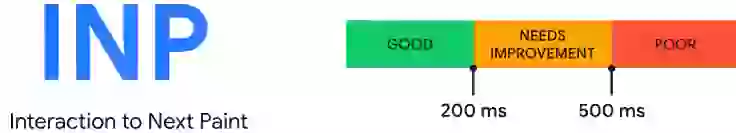
Quais São Boas e Ruins Pontuações de INP?
Para passar na avaliação das Core Web Vitals para a métrica Interaction to Next Paint, o percentil 75 de todas as interações registradas em campo deve ficar abaixo de 200 milissegundos:
- Um INP abaixo ou igual a 200 milissegundos significa que sua página tem boa responsividade.
- Um INP entre 200 e 500 milissegundos significa que a responsividade da sua página precisa de melhorias.
- Um INP acima de 500 milissegundos significa que sua página tem responsividade ruim.
É importante entender que o INP usa o percentil 75, não a média. Isso significa que 75% dos seus usuários reais devem experimentar interações mais rápidas que 200ms. A metodologia do percentil 75 garante que a métrica reflita a experiência de usuários em dispositivos mais lentos e conexões piores, não apenas aqueles com hardware de ponta.
Como Medir o Interaction to Next Paint (INP)
O Interaction to Next Paint só pode ser medido com ferramentas de campo que capturam interações reais de usuários. Ao contrário de métricas de laboratório que simulam um único carregamento de página, o INP requer visitantes reais clicando, tocando e digitando em suas páginas. Não há como obter uma pontuação significativa de INP de um teste sintético porque o INP depende do comportamento humano real.
Obtenha as Métricas Oficiais de INP
Você pode obter as métricas oficiais de INP do PageSpeed Insights ou do painel CrUX e Google BigQuery. O PageSpeed Insights reporta a pontuação do percentil 75 com base nos últimos 28 dias de dados de usuários do Chrome. O Google BigQuery fornece mais contexto histórico e permite consultas personalizadas em todo o conjunto de dados CrUX.
O Google Search Console também reporta problemas de INP na seção Core Web Vitals, agrupando URLs afetadas e sinalizando páginas que precisam de melhorias ou têm responsividade ruim.
Rastreie o INP com Real User Monitoring
Embora o conjunto de dados CrUX oficial seja a fonte definitiva para pontuações de Core Web Vitals, ele é altamente anonimizado e não suporta monitoramento em tempo real ou filtragem detalhada. É por isso que profissionais de desempenho web confiam em ferramentas de Real User Monitoring (RUM) como CoreDash para obter dados práticos de INP em tempo real. Ferramentas RUM coletam medições de INP de cada carregamento de página, as atribuem a elementos específicos, estados de carga e tipos de dispositivo, e permitem diagnosticar exatamente quais interações estão causando problemas.
Meça o INP para a Sessão Atual
A maneira mais simples de depurar o INP durante o desenvolvimento é através do Chrome DevTools. Abra o painel Performance e use o modo "timespan" no Lighthouse para gravar interações e ver sua latência. Você também pode usar a extensão Core Web Vitals Visualizer, que sobrepõe pontuações de INP na página conforme você interage com ela.
Para depuração prática, use a biblioteca JavaScript Web Vitals do Google para registrar interações individuais no console:
Registre o INP no console com a biblioteca JavaScript Web Vitals
<script type="module">
 import {onINP}
 from 'https://unpkg.com/web-vitals@4/dist/web-vitals.attribution.js?module';
 onINP(console.log);
</script>
Como Melhorar o Interaction to Next Paint
Melhorar o Interaction to Next Paint requer otimizar todas as três fases: input delay, processing time e presentation delay. Sua página pode responder instantaneamente à maioria das interações, mas se mesmo uma interação for lenta, ela pode definir toda a pontuação de INP. É por isso que uma abordagem sistemática é necessária.
Dica PageSpeed: na maioria das vezes o INP será muito pior quando um usuário interage com a página durante a fase de inicialização do carregamento da página. Por isso, ao depurar o INP, faz sentido registrar todas as interações, bem como o estado de carregamento da página!
1. Minimize o Input Delay: Previna Tarefas Longas na Thread Principal
Normalmente qualquer página é menos responsiva durante a fase de inicialização, quando a maioria do trabalho da thread principal acontece (análise, decodificação, renderização e scripting). Para manter a thread principal o mais livre possível:
- Remova código não utilizado. Use tree shaking para eliminar código morto e code splitting para dividir seu bundle em pedaços menores que carregam sob demanda. Audite a cobertura do seu código usando Chrome DevTools para identificar scripts que carregam mas nunca executam.
- Carregue código não essencial durante o tempo ocioso do navegador. Você realmente precisa de um widget de chat durante os primeiros 500ms do carregamento da página? Agende scripts não críticos com
requestIdleCallback()para executar apenas quando o navegador estiver ocioso. - Identifique e reescreva scripts lentos que consomem recursos excessivos de CPU. Use o painel Performance do Chrome para encontrar scripts com tempos de execução longos e direcione-os para otimização.
- Mantenha sua página fácil de renderizar. Evite tamanhos de DOM grandes, imagens excessivas, muitos vídeos e animações CSS que consomem CPU.
- Use async e defer em tags de script para evitar que JavaScript bloqueie o parser HTML. Considere adiar JavaScript não crítico inteiramente até depois que a página se tornar interativa.
Quebre Tarefas Longas com scheduler.yield()
JavaScript executa na thread principal do navegador usando um modelo "executar até completar": uma vez que uma tarefa começa, ela bloqueia a thread principal até terminar. Tarefas longas (acima de 50ms) impedem o navegador de responder à entrada do usuário. A API scheduler.yield() permite que você crie explicitamente pontos de yield dentro de código de longa execução, dando ao navegador a oportunidade de processar interações pendentes do usuário antes de continuar.
async function yieldToMain() {
  if ('scheduler' in window && 'yield' in window.scheduler) {
    return await window.scheduler.yield();
  }
  // Fallback for browsers without scheduler.yield()
  return new Promise((resolve) => {
    setTimeout(resolve, 0);
  });
}

// Usage: break up a long task into smaller chunks
async function processLargeDataSet(items) {
  for (let i = 0; i < items.length; i++) {
    processItem(items[i]);

    // Yield every 5 items to let the browser handle user input
    if (i % 5 === 0) {
      await yieldToMain();
    }
  }
}
Adie Trabalho Não Crítico com requestIdleCallback
Use requestIdleCallback() para agendar tarefas não essenciais (analytics, telemetria, prefetching) para quando o navegador estiver ocioso. Isso mantém a thread principal livre para interações do usuário e reduz diretamente o input delay.
// Instead of running analytics synchronously:
document.querySelector('.cta-button').addEventListener('click', (e) => {
  // Critical: update the UI immediately
  showConfirmation();

  // Non-critical: send analytics during idle time
  requestIdleCallback(() => {
    sendAnalyticsEvent('cta_clicked', { page: location.pathname });
  }, { timeout: 2000 });
});
Use Event Listeners Passivos
Para eventos que não precisam chamar preventDefault(), marque seus event listeners como passivos. Isso informa ao navegador que ele não precisa esperar seu manipulador decidir se cancela o comportamento padrão, permitindo rolagem mais suave e resposta ao toque mais rápida.
// Passive listener: browser does not wait for preventDefault()
document.addEventListener('touchstart', handleTouch, { passive: true });
document.addEventListener('wheel', handleWheel, { passive: true });
2. Minimize o Processing Time: Forneça Feedback Imediato
Quando um visitante realiza uma ação como enviar um formulário ou adicionar um item ao carrinho, não espere pela confirmação do servidor antes de atualizar a interface. Forneça feedback visual imediato ("Enviando seu formulário...", "Adicionando item ao carrinho...") e depois complete a operação em segundo plano.
Além disso, faça yield para a thread principal assim que possível após a atualização visual crítica. Como JavaScript segue um modelo "executar até completar", ele bloqueia a thread principal até que todo o código no callback tenha sido executado. Você pode criar manualmente um ponto de yield onde o navegador pode atualizar o layout e depois continuar executando o código não crítico restante.
const formfeedbackEl = document.getElementById("formfeedback");
const formEl = document.getElementById("form");

formEl.addEventListener("submit", (evt) => {
  evt.preventDefault();
  formfeedbackEl.innerText = "Submitting form ... please hold on";

  let headers = new Headers({ Accept: "application/json" });
  let formData = new FormData(formEl);
  fetch("/form-endpoint", { method: "POST", headers, body: formData })
    .then(function (response) {
      return response.json();
    })
    .then(function (jsonData) {
      formEl.reset();
      formfeedbackEl.innerText = jsonData.message;
    });
   setTimeout(other_code_that_needs_to_run(), 0);
});
3. Minimize o Presentation Delay: Mantenha as Coisas Simples
Quando a página precisa ser atualizada após uma interação, o navegador deve recalcular estilos, realizar o layout, pintar os pixels alterados e compor o resultado. A complexidade e o tamanho do seu DOM determinam diretamente quanto tempo esse trabalho de renderização leva.
Alguns ambientes SPA mal otimizados re-renderizam conteúdo demais após cada interação. Por exemplo, ao atualizar um contador, certifique-se de atualizar apenas o elemento do contador, não toda a árvore de componentes.
Siga estas duas regras de ouro para renderização mais rápida:
- Mantenha o DOM pequeno e simples. É muito mais fácil para um navegador renderizar uma página com menos elementos DOM (nós HTML) do que uma página com estruturas DOM complexas e profundamente aninhadas. Almeje menos de 1.400 elementos DOM no total e evite aninhar mais de 32 níveis.
- Use content-visibility para renderizar sob demanda conteúdo fora da tela. A propriedade CSS
content-visibility: autoacelera a renderização inicial adiando a renderização de conteúdo fora da tela até que o usuário role para perto dele.
/* Apply content-visibility to off-screen sections */
.below-the-fold {
  content-visibility: auto;
  contain-intrinsic-size: auto 500px;
}
Depurando INP com a API Long Animation Frames (LoAF)
A API Long Animation Frames (LoAF) é uma ferramenta poderosa para diagnosticar problemas de INP. Ela fornece informações detalhadas sobre frames que levam mais de 50ms para renderizar, incluindo dados de atribuição de scripts que dizem exatamente quais scripts estão contribuindo para interações lentas.
Ao contrário da antiga API Long Tasks, a LoAF captura o tempo de renderização além do tempo de execução de scripts, tornando-a particularmente útil para diagnosticar problemas de presentation delay. Entradas LoAF incluem a duração do frame, a duração de bloqueio e um array de entradas de script que mostram a URL de origem, nome da função e tempo de execução de cada script que executou durante o frame.
// Observe Long Animation Frames to find INP bottlenecks
const observer = new PerformanceObserver((list) => {
  for (const entry of list.getEntries()) {
    // Only look at frames longer than 100ms
    if (entry.duration > 100) {
      console.log('Long frame:', entry.duration + 'ms');

      // Log each script that contributed
      for (const script of entry.scripts) {
        console.log(
          'Script:', script.sourceURL,
          'Function:', script.sourceFunctionName,
          'Duration:', script.duration + 'ms'
        );
      }
    }
  }
});

observer.observe({ type: 'long-animation-frame', buffered: true });
Ferramentas RUM como CoreDash integram dados LoAF automaticamente, correlacionando frames de animação longos com interações específicas do usuário para que você possa identificar exatamente qual script, em qual página, para qual tipo de interação, está causando suas piores pontuações de INP.
INP e LCP: A Conexão de Tarefas Longas
Tarefas longas na thread principal afetam tanto o INP quanto o Largest Contentful Paint (LCP). Uma tarefa JavaScript que bloqueia a thread principal por 200ms atrasa o processamento de eventos (piorando o INP) e também atrasa o navegador de renderizar o elemento LCP (piorando o LCP). Quando você otimiza sua thread principal quebrando tarefas longas, adiando JavaScript não crítico e reduzindo o tempo de execução de scripts, você melhora ambas as métricas simultaneamente.
Estudos de Caso: Melhorias de INP em Produção
redBus: 80 a 100% de Melhoria na Conversão Mobile
A redBus, uma das maiores plataformas de venda de passagens de ônibus online do mundo, investiu na otimização de Core Web Vitals em seus mercados globais. Seu foco em reduzir o tempo de execução JavaScript e otimizar manipuladores de eventos contribuiu para uma melhoria de 80 a 100% nas taxas de conversão mobile em seus mercados globais. As melhorias foram impulsionadas por uma combinação de redução do tempo de bloqueio da thread principal, otimização do carregamento de scripts de terceiros e implementação de code splitting para reduzir a quantidade de JavaScript analisado durante a inicialização da página.
Preply: INP de 250ms para 185ms, $200K por Ano em Economia Estimada de SEO
A Preply, uma plataforma de tutoria de idiomas online, melhorou o INP de sua página inicial de aproximadamente 250ms para 185ms e o INP de sua página de Busca de aproximadamente 250ms para 175ms. A equipe alcançou esses ganhos ao analisar sua aplicação React, identificando e eliminando re-renderizações desnecessárias, e adiando callbacks de eventos não críticos. As pontuações melhoradas de Core Web Vitals se correlacionaram com rankings de busca mais altos, traduzindo-se em um valor estimado de $200.000 por ano em busca orgânica.
O Que os Dados Reais Mostram Sobre INP
A Diferença de INP entre Mobile e Desktop
Dados do CoreDash revelam que o INP mobile (131ms no p75) é 2,8 vezes pior que o INP desktop (48ms no p75). Esta é a maior diferença entre dispositivos de qualquer métrica Core Web Vital. Dispositivos móveis têm processadores mais lentos, menos memória e maior latência de rede, tudo isso contribuindo para tempos de bloqueio da thread principal mais longos e processamento de eventos mais lento. No desktop, 95,6% das interações alcançam uma pontuação "boa" de INP, enquanto no mobile esse número cai para 88,0%. Usuários mobile também experimentam 5 vezes mais eventos de INP "ruim" (9,6% vs 1,9%).
Interações de Teclado vs Ponteiro
Dados do CoreDash mostram que interações de teclado (75ms p75) são 56% mais lentas que interações de ponteiro (49ms p75). Eventos de teclado também têm significativamente mais experiências ruins: 7,4% das interações de teclado resultam em INP ruim, comparado a apenas 1,4% para interações de ponteiro. Essa diferença provavelmente ocorre porque eventos de teclado, especialmente em campos de formulário, acionam processamento mais complexo como validação de entrada, sugestões de autocompletar e atualizações de estado.
Interações Durante o Carregamento vs Pós-Carregamento
Interações que ocorrem durante o carregamento da página têm INP dramaticamente mais alto do que aquelas após o carregamento completo da página. Dados do CoreDash mostram que interações durante a fase de "loading" têm um INP p75 de 132ms, comparado a apenas 50ms para interações pós-carregamento. Isso é uma diferença de 2,6 vezes. Mesmo interações durante a fase "dom-content-loaded" (75ms) mostram INP elevado porque scripts assíncronos e sub-recursos ainda estão sendo processados. Esses dados apoiam fortemente a recomendação de adiar JavaScript não crítico para reduzir a contenção da thread principal durante a inicialização da página.
Taxas Globais de Aprovação de INP
De acordo com o HTTP Archive 2025 Web Almanac, 77% de todas as páginas mobile alcançam uma pontuação "boa" de INP (acima dos 55% em 2022). No entanto, apenas 53% dos 1.000 sites mais visitados passam no INP. Sites de alto tráfego tendem a ter JavaScript mais complexo, mais scripts de terceiros e estruturas DOM mais intrincadas, tudo isso contribuindo para pior responsividade. No desktop, 97% das páginas alcançam boas pontuações de INP, destacando a enorme divisão de desempenho mobile-desktop. O Total Blocking Time mediano em testes de laboratório é 67ms no desktop, mas 1.209ms no mobile.
Perguntas Frequentes
O que é uma boa pontuação de INP?
Uma boa pontuação de INP é de 200 milissegundos ou menos no percentil 75. Isso significa que pelo menos 75% de todas as interações do usuário na página devem ser concluídas em menos de 200ms. Pontuações entre 200ms e 500ms precisam de melhorias, e pontuações acima de 500ms são consideradas ruins. O Google usa esse limiar para a avaliação de Core Web Vitals que alimenta os sinais de ranking de busca.
O que substituiu o First Input Delay (FID)?
O Interaction to Next Paint (INP) substituiu o First Input Delay (FID) como Core Web Vital em março de 2024. O INP é uma métrica mais completa porque mede todas as interações durante uma visita à página (não apenas a primeira) e captura o ciclo de vida completo da interação incluindo input delay, processing time e presentation delay (não apenas o input delay que o FID media).
A rolagem afeta o INP?
Não, a rolagem não afeta o INP. Eventos de scroll são tratados pela thread do compositor do navegador, que opera independentemente da thread principal. O INP mede apenas interações discretas do usuário: cliques, toques e pressionamentos de tecla. No entanto, se sua página usa rolagem baseada em JavaScript (por exemplo, bibliotecas de scroll suave personalizadas), esses manipuladores JavaScript podem acionar callbacks de eventos que contam para o INP. Usar o comportamento de scroll CSS nativo evita esse problema completamente.
Quais interações o INP mede?
O INP mede três tipos de interações discretas do usuário: cliques do mouse (incluindo cliques em botões, links e controles personalizados), toques em tela sensível ao toque (o equivalente mobile de cliques) e pressionamentos de tecla no teclado (incluindo digitação em campos de formulário e pressionamento de teclas de navegação). O INP não mede rolagem, hover, arrasto ou animações CSS. Para cada interação, o INP captura o tempo total desde a entrada do usuário, passando pelo processamento do manipulador de eventos, até o próximo frame visual pintado na tela.
Por que meu INP é pior no mobile?
Dispositivos móveis têm processadores significativamente mais lentos, menos memória disponível e maior latência de rede em comparação com desktops. Essas restrições de hardware significam que JavaScript leva mais tempo para executar no mobile, a thread principal é bloqueada com mais frequência e a renderização requer mais tempo. Dados do CoreDash mostram que o INP mobile (131ms no percentil 75) é 2,8 vezes pior que o INP desktop (48ms). Para melhorar o INP mobile, foque em reduzir o tempo de execução JavaScript, quebrar tarefas longas e minimizar a complexidade do DOM.
Guias Relacionados
Esta página hub cobre os fundamentos do Interaction to Next Paint. Para orientação aprofundada sobre aspectos específicos da otimização de INP, explore estes artigos dedicados:
- <strong>Encontrar e Corrigir Problemas de INP</strong>: Uma metodologia de diagnóstico passo a passo usando Search Console, dados RUM e Chrome DevTools para identificar exatamente quais interações estão causando suas piores pontuações de INP.
- <strong>INP Input Delay</strong>: Cobre a primeira fase do INP. Aprenda como tarefas longas na thread principal bloqueiam o processamento de eventos e como minimizar o input delay com agendamento de tarefas, code splitting e web workers.
- <strong>INP Processing Time</strong>: Cobre a segunda fase do INP. Aprenda como otimizar callbacks de manipuladores de eventos, priorizar código crítico, adiar trabalho não essencial e usar recursos de concorrência do React para reduzir o processing time.
- <strong>INP Presentation Delay</strong>: Cobre a terceira fase do INP. Aprenda como o tamanho do DOM, layout thrashing e renderização do lado do cliente contribuem para atualizações visuais lentas e como reduzir o presentation delay.
Você também pode achar estes guias de otimização PageSpeed úteis para melhorar o INP:
Ponho sites a passar os Core Web Vitals.
Mais de 500K páginas para grandes editoras europeias e e-commerce. Escrevo os fixes e confirmo-os com dados RUM.
Como trabalho
