Metric Breakdown Dashboard
Understand how Core/Dash can help improve the Core Web Vitals and stay fast without regression

Trusted by market leaders
Understanding the Metric Breakdown Dashboard
Let's be direct. Knowing your LCP is 2.8 seconds is just the first step. It's an observation, not a diagnosis. The real work,the work that separates professionals from amateurs,is understanding the why. Is that 2.8 seconds because of a slow server, a massive image, or render-blocking code? If you don't know, you're not optimizing; you're just guessing.
This is the entire purpose of the Metric Breakdown dashboard. It's a forensic tool designed to dissect a single performance metric into its fundamental components. This is where you move from seeing a problem to understanding its root cause.
The Anatomy of the Dashboard
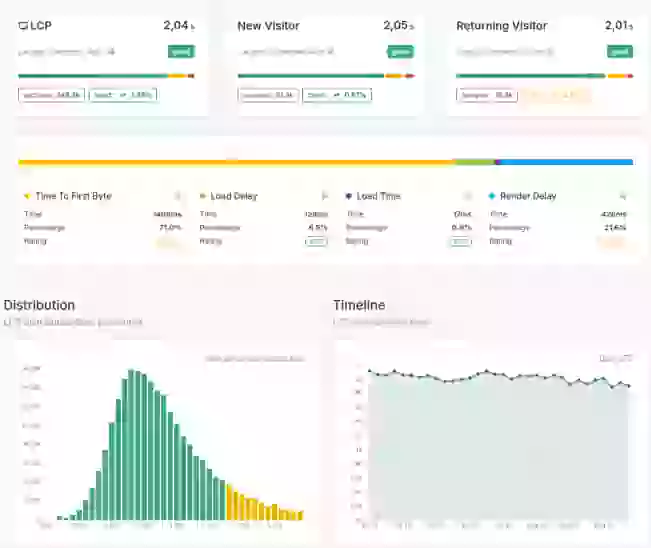
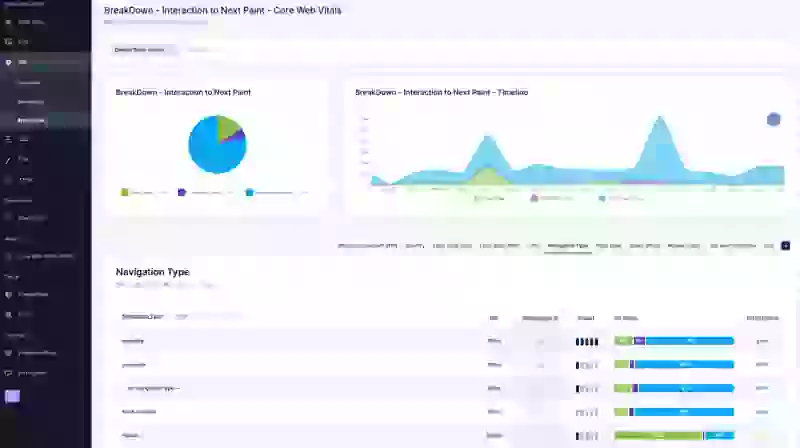
The Metric Breakdown dashboard provides a detailed anatomical view of a single performance metric (LCP, TTFB, or INP), visualizing how the total time is distributed across its constituent parts. The dashboard is composed of three key elements:
- The Donut Chart: This gives you an immediate proportional view, showing the percentage contribution of each sub-part to the total metric. It's your first stop for identifying the biggest relative bottleneck.
- The Timeline Chart: This stacked area chart trends the absolute values of each sub-part over time. It’s how you correlate changes in performance with specific events, like a code deployment or server change.
- The Data Table with Distribution Charts: This is your segmented view. It breaks down the metric by a chosen dimension (like URL or Device) and includes a micro-chart for each row, showing the metric's breakdown for that specific segment.
The Purpose of a Metric Breakdown
A top-level metric tells you if you're winning or losing. A breakdown tells you why. Without this view, your developers are flying blind, wasting hours trying to find the source of a problem that the data can pinpoint in seconds.
- Eliminate Guesswork: Stop debating whether the problem is the frontend or the backend. The LCP breakdown will tell you definitively if `Time to First Byte` is the issue, pointing directly to a server-side problem.
- Precision and Efficiency: Instead of telling your team "the site is slow," you can tell them "the Resource Load Duration for the main hero image on mobile is too high." This level of precision saves countless hours and leads to faster, more effective fixes.
- Find Hidden Problems: The distribution charts in the data table allow you to spot outliers instantly. You can scroll through your top 50 pages and see if one of them has a completely different performance profile, indicating a unique, page-specific issue that would otherwise be lost in the site-wide average.
The Diagnostic Workflow
This dashboard is built for a specific diagnostic workflow. Follow this process to get to the root cause quickly.
- Start Broad, Then Go Deep: Begin on the Main RUM Dashboard. You notice your LCP is poor.
- Isolate the "Why": Navigate to the LCP Breakdown dashboard. The donut chart immediately shows `Time to First Byte` accounts for 70% of your total LCP. You now know the problem is with the server/backend.
- Isolate the "Where": Look at the data table at the bottom, segmented by `URL`. You can see your 5 slowest pages. Look at their Distribution charts—they all confirm that the yellow `TTFB` portion is dominant. The problem is systemic across your slowest pages.
- Go Deeper: Now that you know TTFB is the root cause, you can navigate to the TTFB Breakdown dashboard for an even more detailed analysis. There, you might discover that the `Waiting (TTFB)` sub-part is the primary bottleneck.
In just a few clicks, you've gone from a vague "our LCP is slow" to a precise, actionable insight: "Our server's processing time is the root cause of our slow LCP on our most important pages."
The Bottom Line
Top-level metrics are for status reports. Breakdowns are for getting work done. Use this dashboard to arm your team with the precise data they need to fix the right problems, faster. This is how you build a culture of performance based on evidence, not assumptions.

