Analyzing Trends with Time-Series
Understand how Core/Dash can help improve the Core Web Vitals and stay fast without regression

Trusted by market leaders
Analyzing Trends with Time-Series Charts
A single performance score is a snapshot. It’s a moment in time. It's useful, but it's fundamentally incomplete. Your website isn't static, your users aren't static, and your performance certainly isn't static. It's a living, breathing metric that responds to everything from code deployments to marketing campaigns.
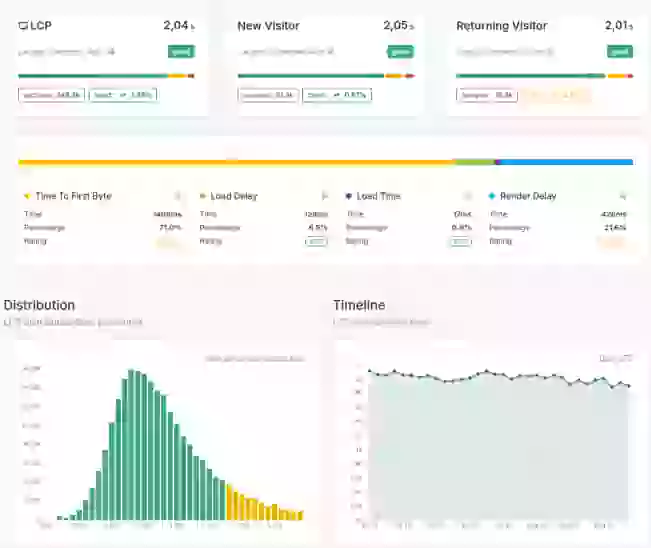
If the Main RUM Dashboard is your command center, then the Time-Series Chart is your primary scanner. It visualizes the narrative of your website’s performance over time. This is where you move beyond looking at a single number and start understanding the story of your users' experience.
What You're Really Looking At
At first glance, it's just a line on a graph. But to a professional, it’s a detailed story. Understanding its language is critical.
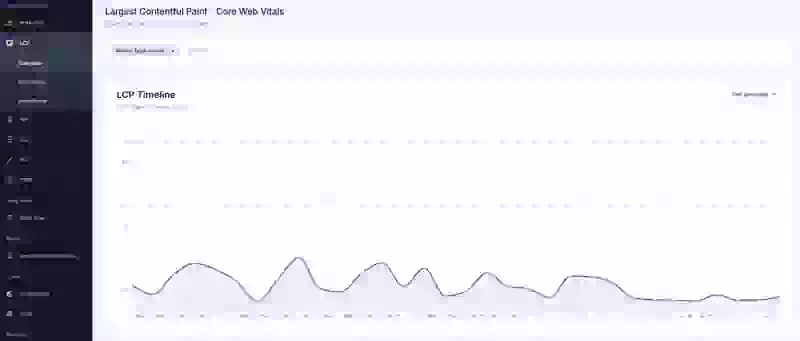
- The Y-Axis (Performance): This vertical axis represents the metric you're analyzing—be it Largest Contentful Paint (LCP) in milliseconds or Cumulative Layout Shift (CLS) as a score. Lower is almost always better. This tells you how good or bad the experience was.
- The X-Axis (Time): This horizontal axis is what gives the chart its power. It represents the flow of time—hours, days, or weeks. This tells you when the experience happened.
- The Line (The Trend): This is the story itself. Each point on that line is an aggregated performance value (e.g., the 75th percentile) for a specific slice of time. The line connecting these points reveals the trend, showing you the trajectory of your user experience.
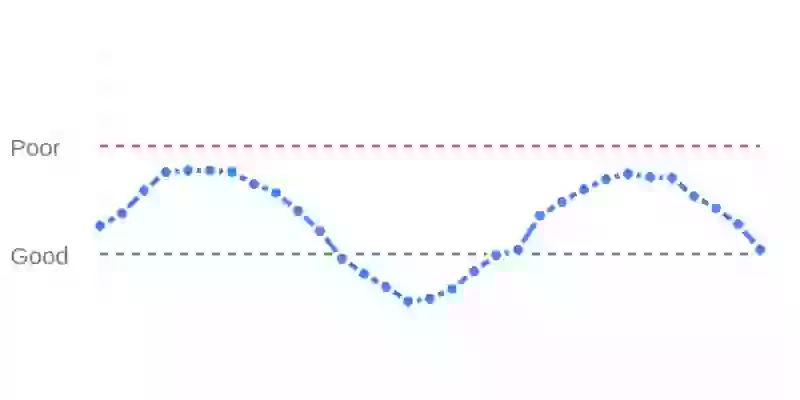
- Performance Zones: Core/Dash Time series charts will display horizontal lines, in green and red. These aren't random; they represent the official Core Web Vitals thresholds for "Good," "Needs Improvement," and "Poor." Your goal is to keep your performance trend line consistently within the green quadrant. A line in the red quadrant indicates a poor user experience that requires immediate attention.
How to Read the Story in the Data
This isn't a passive chart for a weekly report. It's an active diagnostic tool. Here's what you should be looking for:
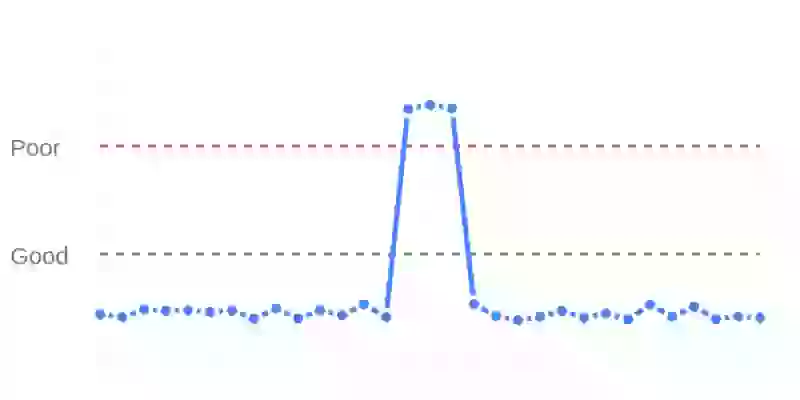
- Sudden Spikes: The Regressions A sharp, sustained upward spike is an alarm bell. It’s the clearest signal that something has gone wrong. This isn't a theoretical problem; it means that from that point forward, a huge number of your users are having a worse experience.
Your Action: The moment you see a spike, ask: What changed at that exact time? Was there a code deployment? A new marketing banner activated? A third-party script updated? The chart gives you the "when," so you can pinpoint the "what."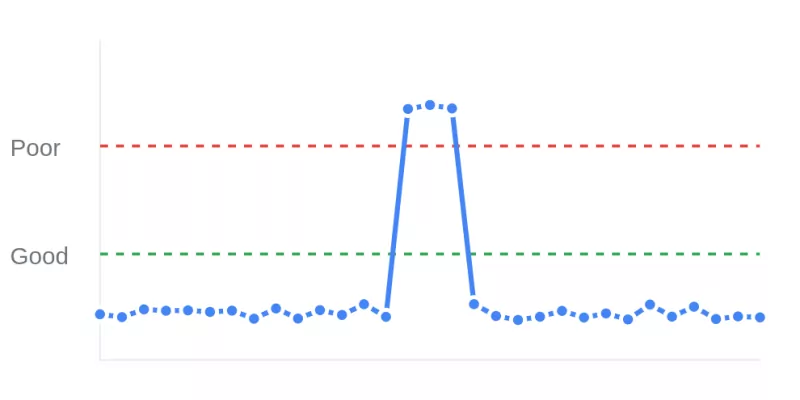
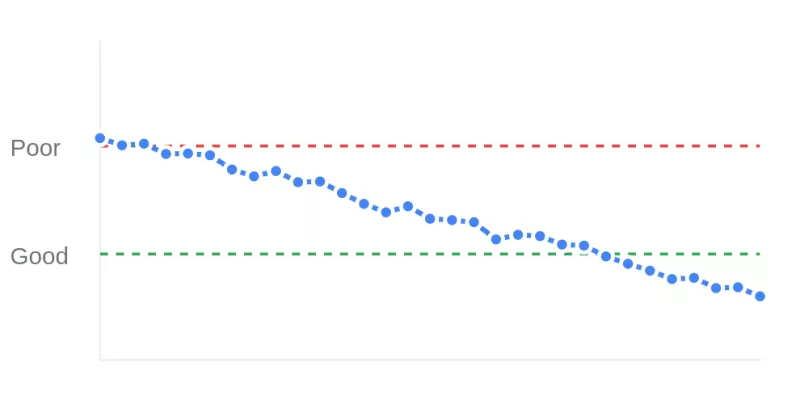
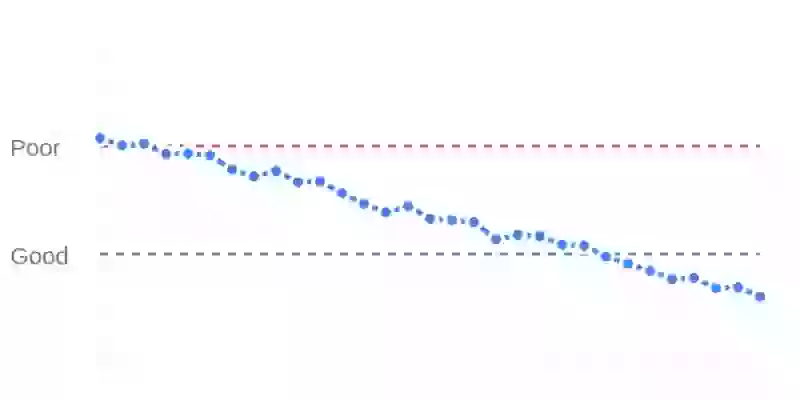
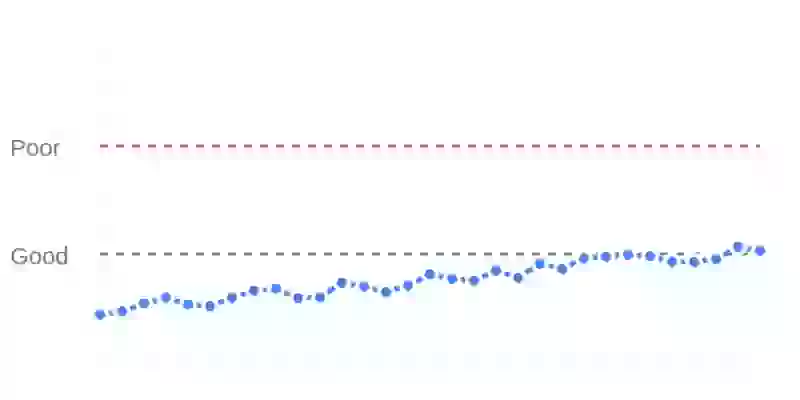
- Downward Trends: The Validations This is the proof your work is paying off. After deploying an optimization—compressing images, deferring JavaScript, enabling `fetchpriority="high"` on an LCP image—you should see a clear and sustained drop in the corresponding metric. This isn't just a "feel good" chart; this is the data you use to prove the ROI of your performance efforts to stakeholders.
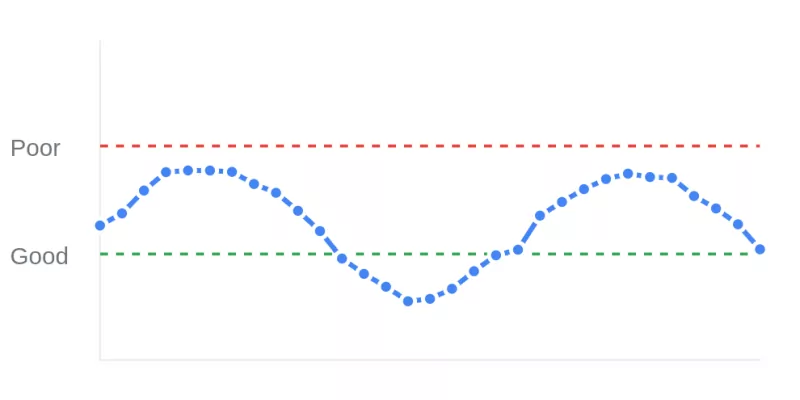
- Recurring Patterns: The Systemic FlawsLook for cycles. Does INP spike every weekday at 9 AM when users flood the login page? Does TTFB get worse every night at midnight when a database-intensive cron job runs? These repeating patterns expose underlying infrastructure or application bottlenecks that a single lab test will never catch.
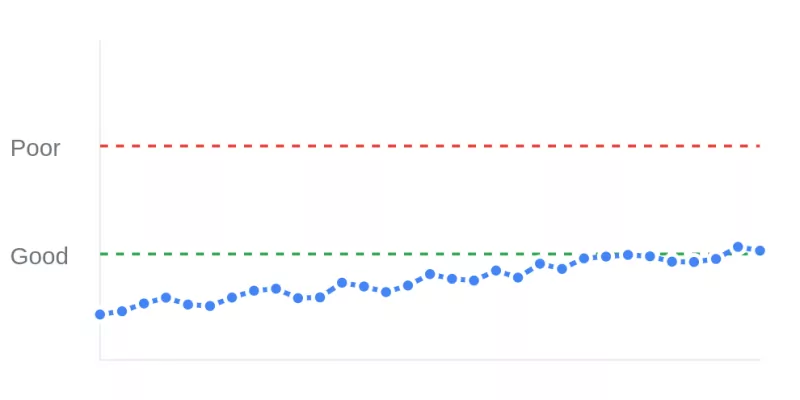
- Gradual Drifts: The Slow Decay Performance doesn't always die in a fire; sometimes it slowly bleeds out. A gentle but steady upward slope over weeks is a sign of "performance death by a thousand cuts"—minor changes, added features, and growing database tables slowly degrading the user experience. This chart makes that invisible decay visible so you can act before it becomes a major problem.
From 'What' to 'Why'
The time-series chart tells you what happened and when it happened. It gives you the "X" that marks the spot.
Your very next step is to find out why. See that spike from yesterday afternoon? Filter your RUM data to that specific timeframe. Now, start using the Filtering & Dimensions. Is the regression only on mobile? Is it isolated to a single URL? Is a new LCP element the culprit?
The time-series chart identifies the target. The dimensions are how you dissect it.
The Bottom Line
Stop treating performance like a single score you check once a week. Start treating it like the dynamic, critical business metric it is. The time-series chart is your tool for continuous vigilance. Use it to catch regressions before they cost you, to prove the value of your optimizations, and to understand the real story of how users experience your site.

