Fix & Identify Cumulative Layout Shift (CLS) Issues
Learn how to find and fix all Cumulative Layout Shift issues using RUM data, Chrome DevTools, and targeted CSS and HTML fixes

Find and Fix Cumulative Layout Shift (CLS) Issues
This page is part of our Cumulative Layout Shift (CLS) series. CLS measures the visual stability of your page by tracking unexpected content movement. A good CLS score is below 0.1, scores above 0.25 are poor. If you are new to CLS, start with the CLS hub page for the formula, thresholds, and session window mechanics.
CLS is the best-performing Core Web Vital. According to the 2025 Web Almanac, 72% of websites pass CLS globally. That sounds great until you realize that most developers never see CLS problems on their own machines. The shifts happen for first-time visitors on slow connections, and by the time you check in DevTools with your warmed cache, everything looks fine. That is exactly what makes CLS tricky to debug.
This guide is based on the exact step-by-step process I use when consulting on CLS. CrUX and RUM data first, validate in Chrome and then write the fix.
Last reviewed by Arjen Karel on March 2026
CLS TIP: CLS is measured in session windows, not as a running total. The browser groups layout shifts into sessions (max 5 seconds, 1 second gaps between shifts) and your CLS score is the worst session. A single burst of shifts during page load can fail your CLS even if the rest of the visit is perfectly stable.
Table of Contents!
Step 1: Check CLS in Search Console
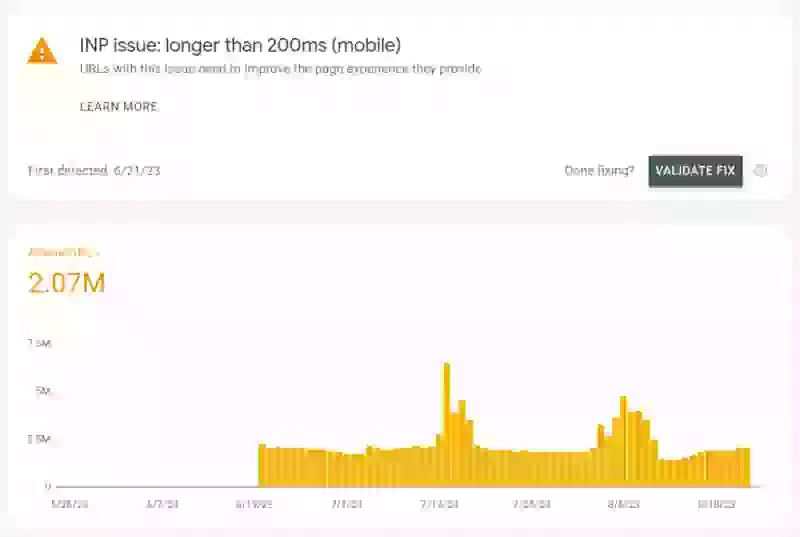
Before changing anything, confirm that you actually have a CLS problem. Log in to Google Search Console, navigate to Core Web Vitals, and check both mobile and desktop.
If Google is flagging URLs with "CLS issue: more than 0.25" or "CLS issue: more than 0.1," you have confirmation from the Chrome User Experience (CrUX) Report that real users are experiencing layout shifts on your site.
Unlike LCP and INP where raw computing power and network speed matter, CLS problems can be device or screensize specific. When a similar issue affects mobile and desktop (unsized images, font swaps, injected content) because of the screen size desktop might report a far larger CLS value (because a larger part of the visible viewport may be affected). Search Console groups URLs together, so it tells you which page types are affected but not which elements are shifting. For that you need Real User Monitoring.
Step 2: Identify CLS Issues with RUM Data
Search Console confirms the problem exists but gives you almost nothing to work with. You need to find which elements are shifting, on which pages and under what conditions. For that you need a RUM tool.
I built CoreDash to answer exactly these questions. You add one script tag and it starts collecting CLS attribution data from every real visitor. The key data point for CLS debugging is the shifting element: the actual DOM node that moved. Without that information you are debugging blind.
Find shifting elements
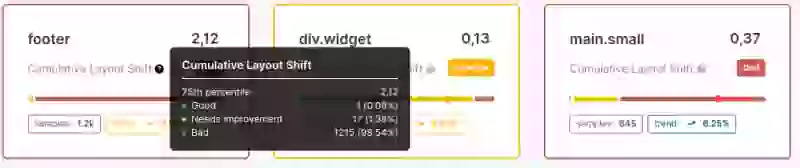
Start by looking at your CLS data grouped by element. In CoreDash, navigate to the CLS page and view the data table sorted by "CLS by Element." This shows which elements cause the most layout shift across all your visitors. Click on the worst one to filter all metrics for pages where that element shifted.
Find which pages are affected
After filtering by the most impactful shifting element, check the URL breakdown. CLS problems might be site-wide or template wide. Now we know if the CLS is clustered on specific page types: product pages with image galleries, blog posts with ad slots, or landing pages with hero animations. Knowing which pages fail tells you where to focus.
Check new visitors vs. repeat visitors
This is another quick check that I do and it matters more than most people think. Font-swap CLS only happens when the font is not cached. Image CLS from width: auto only happens when the image is not in the browser cache. If your CLS is much worse for first-time visitors, you are dealing with a caching-dependent shift that you, as the developer, will never see on your own machine unless you disable the cache (tip: always disable your Chrome cache ... but that is another story for another day).
Check device types and viewport sizes
CLS typically shows another mobile/desktop pattern than LCP and INP. Responsive layouts can introduce shifts that only appear at specific viewport widths and heights. An ad slot that caused issues on desktop might not even be in the mobile viewport. A navigation menu might animate differently at smaller breakpoints. Group your CLS data by device type to know where they happen.
Step 3: Debug CLS with Chrome
Your RUM data has told you which elements shift and why. Now reproduce the issue locally and find what is causing it.
Use the Core Web Vitals Visualizer
The fastest way to see layout shifts is with the Core Web Vitals Visualizer Chrome extension. Load the page, click the extension icon, and reload. Every layout shift gets highlighted with a colored overlay showing exactly what moved and by how much. I use this as my first step before opening the Performance panel because it gives an immediate visual answer.
Replicate the conditions in Chrome and check the network screenshots
CLS problems are often invisible with a warm cache. Open DevTools, disable the cache in the Network tab, and throttle the connection to "Slow 4G" (my favorite, it will show you CLS caused by race conditions). Now click the gear icon and disable caching (while DevTools is open). This simulates the conditions your first-time visitors experience. Go to the network tab and enable screenshots. Now reload the page and watch for shifts.

Use the Chrome Performance panel
Most layout shifts are easy to spot when you know how but sometimes they will elude you. That is the time to open Chrome DevTools (Ctrl+Shift+I) and go to the Performance panel for detailed debugging. Press Ctrl+Shift+E to reload and record. After the page loads, scroll up and down a few times. Stop the recording.
Look for the "Layout Shifts" track. Each shift appears as a colored block. Click on a shift to see:
- The shifting node: the DOM element that moved
- The shift score: impact fraction multiplied by distance fraction
- hadRecentInput: whether user input preceded the shift (clicks and taps get a 500ms grace period, but scroll does not)
Pay attention to when the shifts happen. Shifts during page load point to unsized images, font swaps, or CSS transitions. Shifts during scrolling point to scroll-triggered animations using layout properties.

Quick test: disable all transitions
CSS transitions that animate layout properties are a sneaky CLS cause because they only shift during the loading phase and are hard to reproduce. Paste this snippet in the console, hard-reload the page with cache disabled, and compare the CLS:
document.head.insertAdjacentHTML('beforeend',
  '<style>*{transition-property:none!important}</style>');
If your CLS drops after disabling transitions, you have found the cause. Use the CSS transition debugging guide to find the specific transitions responsible.
Measuring CLS with the Layout Instability API
The Layout Instability API gives you direct access to every layout shift in JavaScript. This is the same API that RUM tools use under the hood:
const observer = new PerformanceObserver((list) => {
  for (const entry of list.getEntries()) {
    if (!entry.hadRecentInput) {
      console.log('Layout shift:', {
        value: entry.value,
        sources: entry.sources?.map(s => ({
          node: s.node,
          previousRect: s.previousRect,
          currentRect: s.currentRect
        }))
      });
    }
  }
});
observer.observe({ type: 'layout-shift', buffered: true });
The sources array shows which elements moved. hadRecentInput filters out expected shifts from clicks and taps. For production measurement, use CoreDash or another RUM tool.
Step 4: Fix CLS Issues
You know which elements shift and why. Time to fix them. CLS does not have sequential phases like LCP. Instead, layout shifts have distinct cause categories. Here are the most common ones, in the order I encounter them during audits.
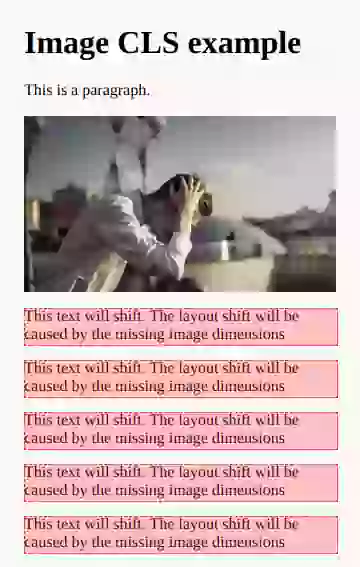
1. Images, Videos, and Iframes Without Dimensions
This is the number one cause of CLS on the web. The 2025 Web Almanac reports that 62% of mobile pages have at least one unsized image. The fix: always include width and height attributes on <img>, <video>, and <iframe> tags.
<img src="hero.jpg" width="800" height="450" alt="Description">

<style>
img {
    height: auto;
    max-width: 100%;
}
</style>
Watch out for width: auto in your CSS. This single declaration overrides the browser's aspect ratio calculation and causes layout shifts even when you have set width and height in the HTML. I have seen this on dozens of sites. The developer did everything right in the markup, but a global CSS rule like img { width: auto; height: auto; max-width: 100%; } undid all of it. For the full explanation, see fix layout shift caused by auto-sizing images. For a complete guide covering all image and media CLS causes (videos, iframes, art direction, responsive images, lazy loading, placeholders), see How Images and Media Cause Layout Shift.
2. Web Font Swaps
When a web font loads and replaces the fallback font, the size difference causes a layout shift. The 2025 Web Almanac shows only 11% of pages preload web fonts. That means the vast majority of sites are vulnerable to font-swap CLS.
The fix has two parts. First, make the fallback font match the web font dimensions using metric overrides:
<style>
@font-face {
    font-family: 'My Font Fallback';
    src: local('Arial');
    size-adjust: 105.2%;
    ascent-override: 93%;
    descent-override: 24%;
    line-gap-override: 0%;
}

@font-face {
    font-family: 'My Font';
    src: url('/fonts/myfont.woff2') format('woff2');
    font-display: swap;
}

body {
    font-family: 'My Font', 'My Font Fallback', sans-serif;
}
</style>
Use a Fallback Font Generator to calculate the correct override values for your font pairing. Second, speed up delivery: self-host your fonts, preload your critical font file, and use WOFF2 with subsetting. For a complete strategy, see responsive web font loading and ensuring text remains visible during web font load.
3. CSS Animations and Transitions
According to the 2025 Web Almanac, 40% of mobile pages run non-composited animations. These animate properties like width, height, top, left, margin, and padding that trigger layout recalculation on every frame.
The most common offender is transition: all. When a developer writes transition: all .3s ease, every property change gets animated, including layout properties. During page load, elements transitioning from their unstyled to styled state produce layout shifts that happen intermittently and are nearly impossible to reproduce consistently. I see this pattern all the time.
The fix: replace layout-triggering properties with composited ones.
- Use
transform: translateY()instead oftop/bottom - Use
transform: translateX()instead ofleft/right - Use
transform: scale()instead ofwidth/height - Use
opacityinstead ofvisibilitycombined with height changes - Never use
transition: all. Specify the exact property:transition: background-color .2s ease
transform and opacity run entirely on the compositor thread and never trigger layout. For the full debugging process, see layout shift caused by CSS transitions.
4. Ads, Embeds, and Dynamically Injected Content
Ads load late and push content down. Cookie consent banners appear and shift the page. AJAX requests inject new content without reserving space first. These are all the same problem: something appears on the page that the browser did not know about at render time.
The fix for all of these is reserving space. For ad slots, set a min-height matching the expected ad size:
<style>
.ad-slot {
    min-height: 250px;
    contain: layout style;
}
@media (min-width: 600px) {
    .ad-slot { min-height: 90px; }
}
</style>
The contain: layout style declaration isolates the ad container from the rest of the page. For cookie banners, use position: fixed to overlay instead of pushing content down. For AJAX content, reserve space with min-height. You do not need an exact guess: a 50px mismatch is far less CLS than a 400px shift from no reservation.
For third-party embeds like YouTube, Google Maps, and chat widgets, use the facade pattern: show a static placeholder and only load the real embed when the user interacts with it. Zero CLS, zero wasted resources.
5. Scroll-Triggered Layout Shifts
This is the CLS cause that Lighthouse will never catch. Lighthouse does not scroll the page, so scroll-triggered layout shifts are completely invisible in lab testing. The only way to find them is with RUM data or by recording a Performance panel trace while scrolling manually.
The most common example is a hide-on-scroll header that animates the top property. Here is the thing most developers do not know: scroll is not an excluding input in the Layout Instability specification. Clicks and taps get a 500ms grace period. Scroll does not. Every layout shift triggered by scrolling counts toward your CLS score.
The fix: use transform: translateY() instead of top for any scroll-triggered animation. Same applies to parallax effects, shrinking navigation bars, and scroll-linked progress bars. If it moves on scroll, animate it with transform. For the full walkthrough with video examples, see how scroll-triggered animations cause CLS.
Quick Fix Checklist
| CLS Cause | How to Detect | Fix |
|---|---|---|
| Unsized images/videos | Lighthouse "unsized images" audit | Add width and height; remove width: auto from CSS |
| Web font swaps | RUM: CLS worse on first visit only | Font metric overrides; preload WOFF2; self-host fonts |
| CSS transitions | Console snippet to list all transitions | Replace transition: all with specific properties; use transform/opacity |
| Late-loading ads | RUM attribution showing ad container elements | min-height on ad slots; contain: layout style |
| Cookie consent banners | CLS spike on first visit; banner in attribution data | Use position: fixed overlay instead of pushing content |
| Scroll animations | Performance trace while scrolling; field CLS > lab CLS | Replace top/left/height with transform |
Related Guides
- How Images and Media Cause Layout Shift: The complete guide to CLS from unsized images, videos, iframes, art direction, responsive images, lazy loading, and placeholders.
- Fix Layout Shift Caused by Auto-Sizing Images
- Layout Shift Caused by CSS Transitions
- Scroll-Triggered Animations and CLS
- Ensure Text Remains Visible During Web Font Load
- Self-Host Google Fonts
- Responsive Web Font Loading
For a complete overview of all Core Web Vitals, visit the Core Web Vitals hub or use the Ultimate Core Web Vitals Checklist to audit your entire site.
CoreDash has MCP built in.
Connect it to Claude or any AI agent. Ask it why your INP spiked last Tuesday.
See how it works
